Written by: Brianne Minton
With Technical Expertise From: Dr. Lee Ellenburg & Dr. Rob Junod
Alabama’s climate in 2025 followed patterns that many residents know well. The year featured a mix of wet and dry periods, including the wettest May on record, record-setting snowfall during the January 20th–22nd Gulf Coast blizzard, and a return to persistent drought later in the year. While several notable events occurred, much of the year reflected the state’s typical variability between wet and dry conditions. Overall, 2025 finished warmer and drier than normal statewide.
Precipitation
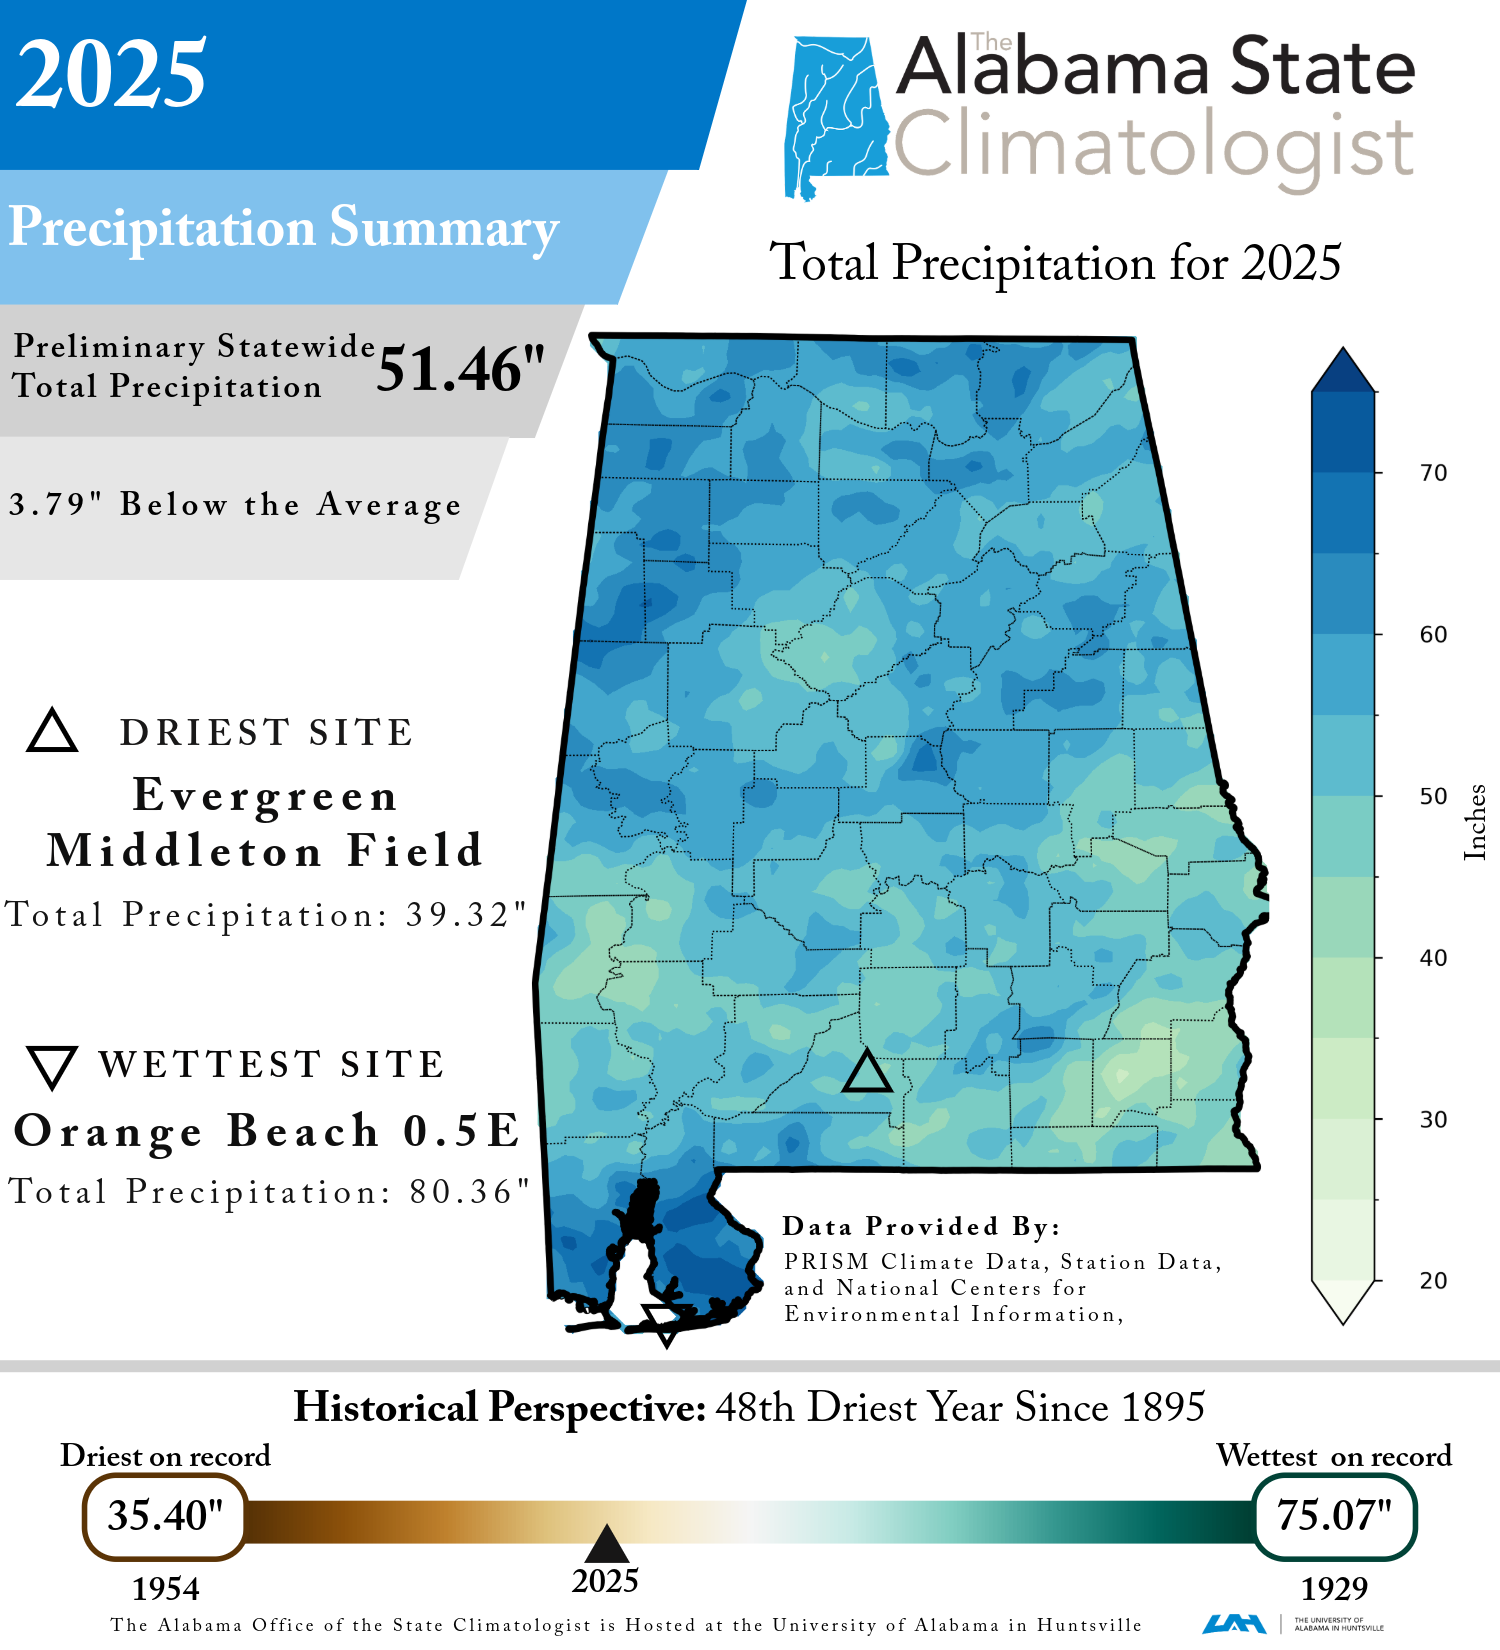
In 2025, statewide precipitation totaled 51.46 inches, which was 3.79 inches below normal and ranked as the 48th driest year on record. Rainfall distribution varied considerably across Alabama. Parts of the Gulf Coast recorded more than 80 inches of rain during the year, while some inland areas received less than 40 inches (Figure 1). Some of that precipitation fell as snow, as a historic storm blanketed the northern Gulf Coast and dropped over 10 inches in parts of South Alabama.
Monthly rainfall patterns showed sharp contrasts. Early in the year, several heavy rainfall events produced new daily records at individual locations. Muscle Shoals received 6.01 inches of rain on March 15, and Fayette recorded 9.27 inches on May 13. Although significant, these events were localized and did not reflect broader statewide trends. May was by far the standout month. It was the wettest May on record since 1895. Average precipitation reached 10.07 inches for the month, which was 5.83 inches above the long-term average. Conditions became drier later in the year. July ranked as the 8th driest July on record, and November ranked as the 18th driest. Overall, eight of the twelve months ended below normal for precipitation. In fact, the final six months of the year were especially dry and ranked as the second driest six-month period on record statewide. The following table outlines 2025 monthly precipitation totals and highlights the wettest and driest location each month. Brown indicates months that were drier than normal, and green indicates months that were wetter than normal.
Local precipitation reports continue to play an important role in understanding these patterns. The Alabama Office of the State Climatologist serves as the state coordinator for the Community Collaborative Rain, Hail, and Snow Network (CoCoRaHS), which is a national citizen science program that provides valuable, high-resolution rainfall data across the state. Through CoCoRaHS, anyone can use a standard, low-cost rain gauge to measure and report daily rainfall totals from their homes. We are grateful to the many volunteers who contribute to these observations and look forward to sharing more about this program and our observers in future blog posts!
|
2025 Monthly Precipitation Review |
|||
|
Month |
Monthly Precipitation Totals |
Driest Location(s) That Month |
Wettest Location(s) That Month |
|
January |
3.28” |
Talladega |
Bevill Lock & Dam |
|
February |
4.39” |
Andalusia |
Alexander City |
|
March |
5.16” |
Wetumpka |
Tuscumbia |
|
April |
5.40” |
Dothan |
Spanish Fort |
|
May |
10.07” |
Brewton |
Crossville |
|
June |
6.82” |
Gulf Shores |
Gainesville |
|
July |
2.95” |
Russellville |
Gulf Shores |
|
August |
3.67” |
Decatur |
Foley |
|
September |
1.80” |
Montgomery |
Toney |
|
October |
3.15” |
Dothan |
Lillian |
|
November |
1.61” |
Gulf Shores |
Holt |
|
December |
2.74” |
Bevill Lock & Dam |
Gulf Shores |
Temperature
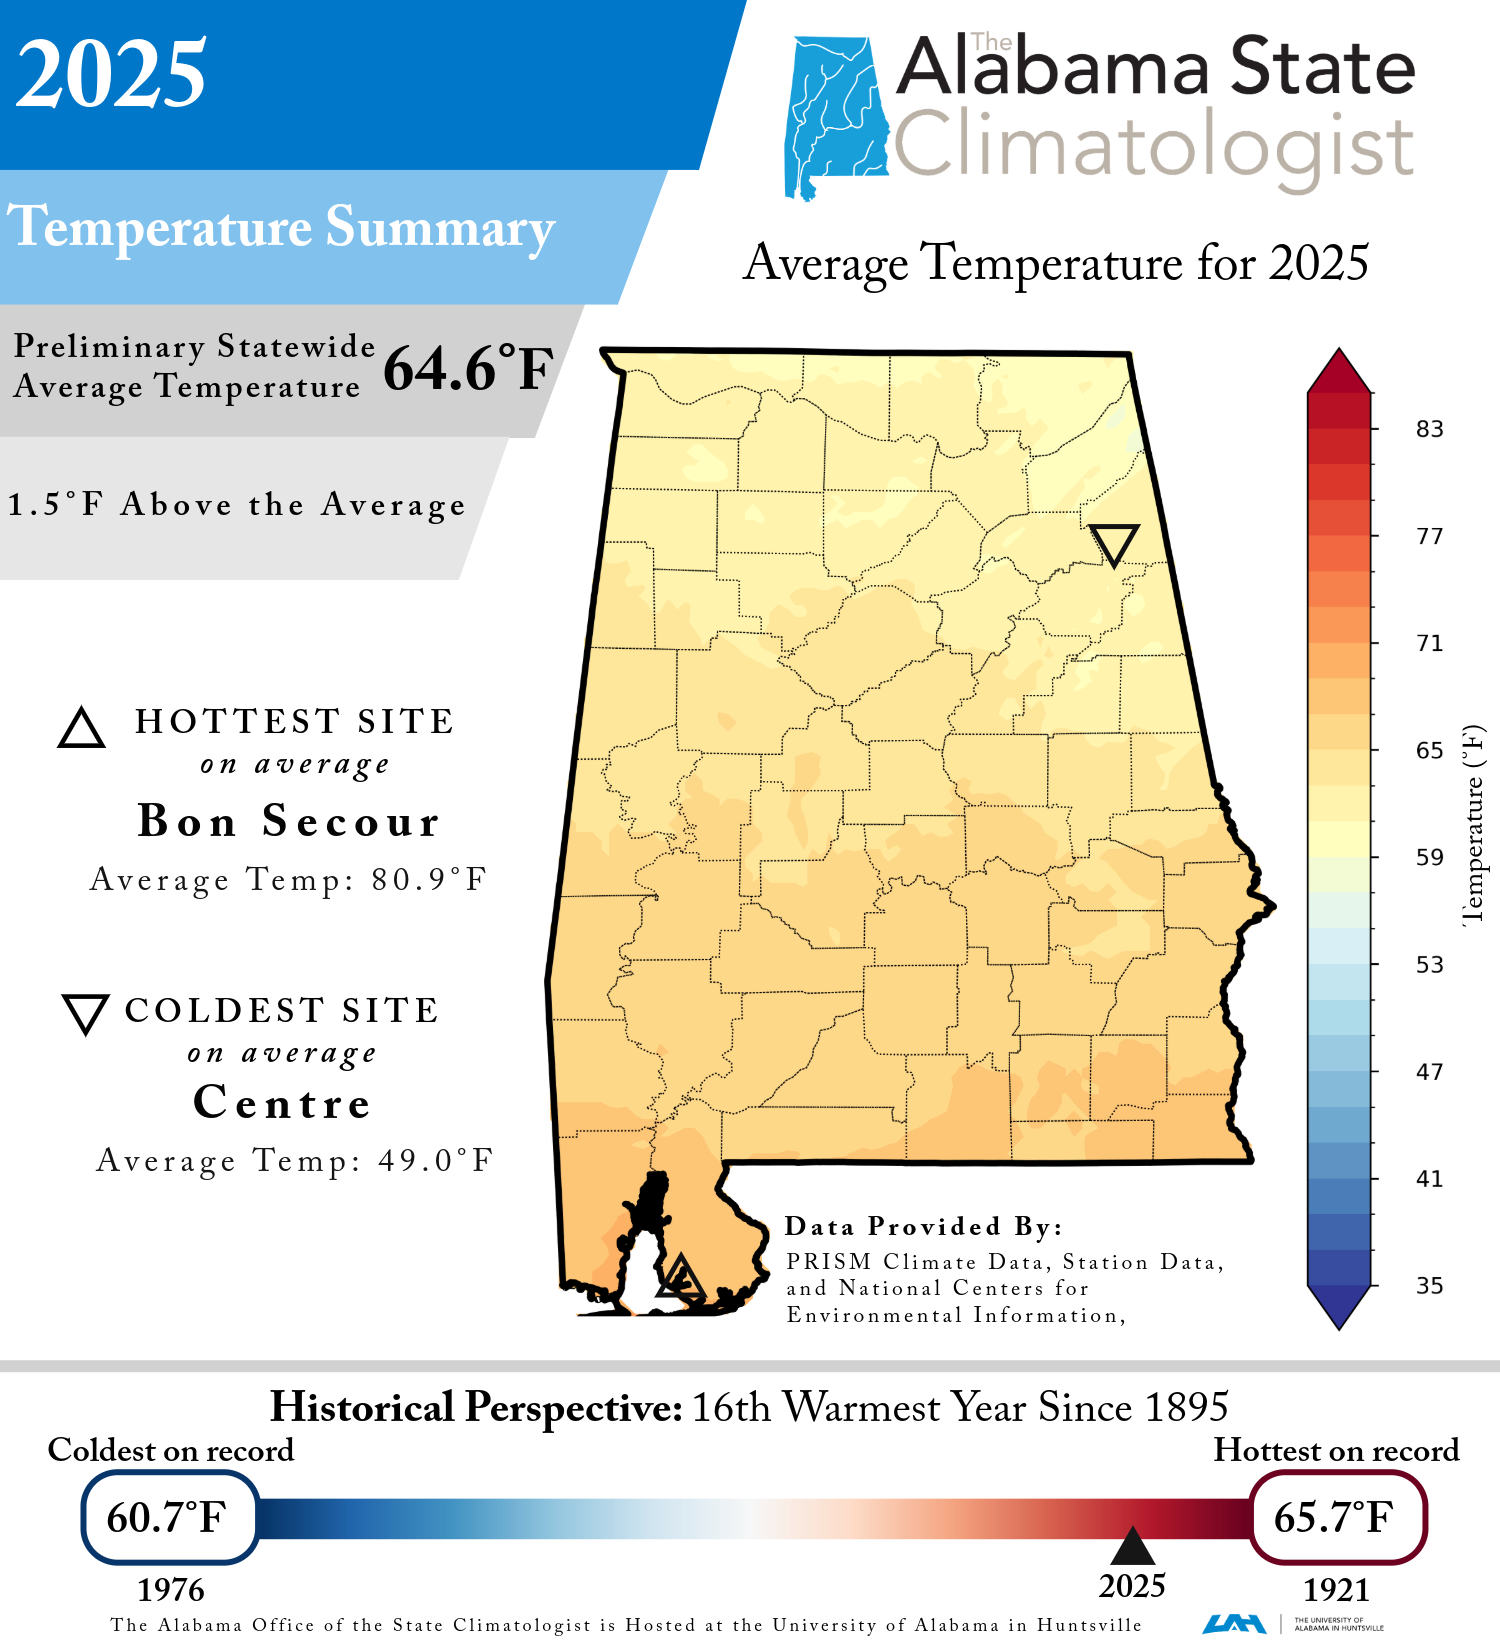
Temperatures were consistently warmer than normal statewide. The average annual temperature was 64.6°F, which was 1.5°F above normal and ranked as the 16th warmest year on record (Figure 2). Above-normal temperatures were observed in 10 of the 12 months. The spring season (March–May) ranked as the 5th warmest on record, while April and July each ranked as the 11th warmest since records began in 1895.
Only two months experienced colder than average temperatures. January was notably cooler than normal, averaging 5.1°F below normal statewide, while August was slightly cooler at 1.3°F below normal. Bon Secour recorded the highest annual average temperature at 80.9°F, while Centre recorded the lowest annual average temperature at 49.0°F. Persistent warmth increased evaporation rates and water demand, contributing to the development and persistence of dry conditions later in the year. The following table outlines 2025 monthly statewide temperatures and highlights the coldest and hottest location each month. Blue indicates months that were colder than normal, and red indicates months that were warmer than normal.
|
2025 Monthly Temperature Review |
|||
|
Month |
Monthly Average Statewide Temperature |
Coldest Location(s) That Month |
Hottest Location(s) That Month |
|
January |
40.2°F |
Russellville |
Evergreen |
|
February |
52.8°F |
Valley Head |
Evergreen & Andalusia |
|
March |
58.5°F |
Valley Head & Scottsboro |
Northport, Oakmulgee, Bon Secour, Open Pond, & Mobile |
|
April |
67.0°F |
Valley Head |
Open Pond |
|
May |
72.1°F |
Ashland |
Open Pond & Atmore |
|
June |
78.4°F |
Ashland, Hamilton, & Fort Payne |
Bon Secour |
|
July |
82.2°F |
Scottsboro |
Dothan, Evergreen, Selma, & Vernon |
|
August |
78.4°F |
Scottsboro |
Vernon, Huntsville, Decatur, & Birmingham |
|
September |
76.0°F |
Russellville |
Selma & Oakmulgee |
|
October |
65.9°F |
Valley Head, Addison, Montgomery, Scottsboro, Rock Mills, Hope Hull, & Ashland |
Oakmulgee |
|
November |
56.0°F |
Addison |
Open Pond, Montgomery, Hope Hull, & Dothan |
|
December |
48.1°F |
Vinemont & Liri |
Oakmulgee |
Drought
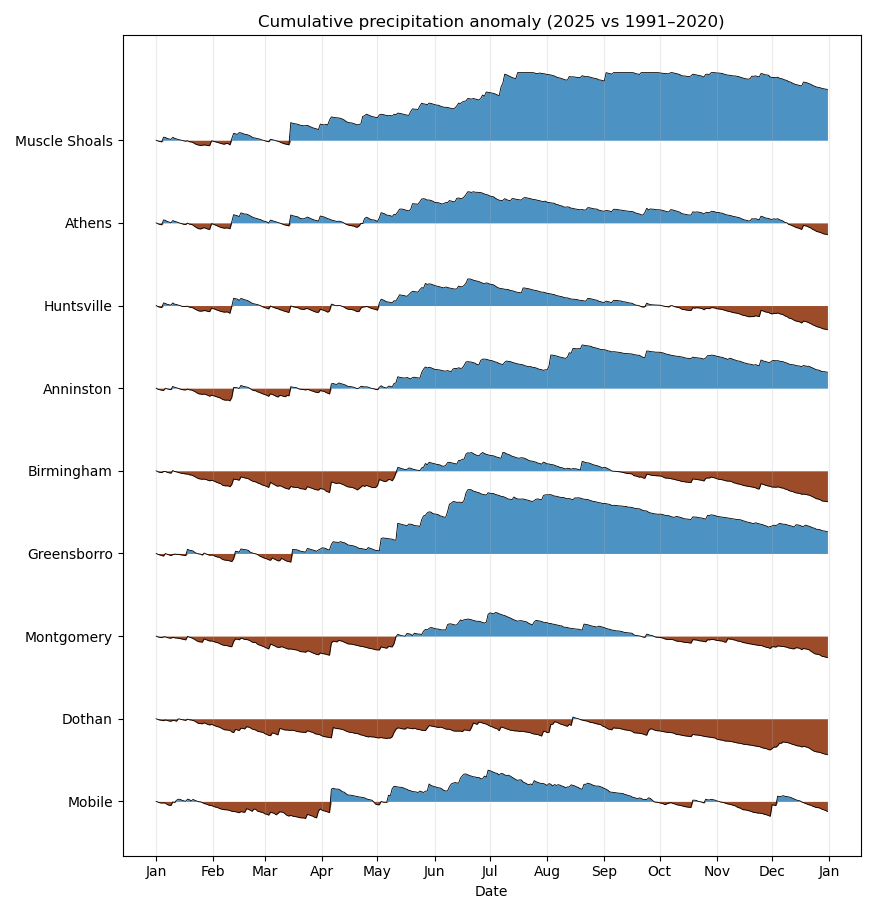
Drought conditions evolved steadily throughout the year. Dryness carried over from fall and winter 2024 but improved through late winter and early spring. By April, drought coverage had nearly disappeared, and following the wettest May on record, the state was drought free by June. Conditions began to deteriorate again as summer transitioned into fall. Fall precipitation in Alabama often depends on tropical systems, and few affected the state during the year. Without this seasonal rainfall, dryness intensified. By the end of the year, 100 percent of Alabama was classified in at least abnormal dryness or drought. For more information, check out Figure 3 in our December 2025 Climate Report.
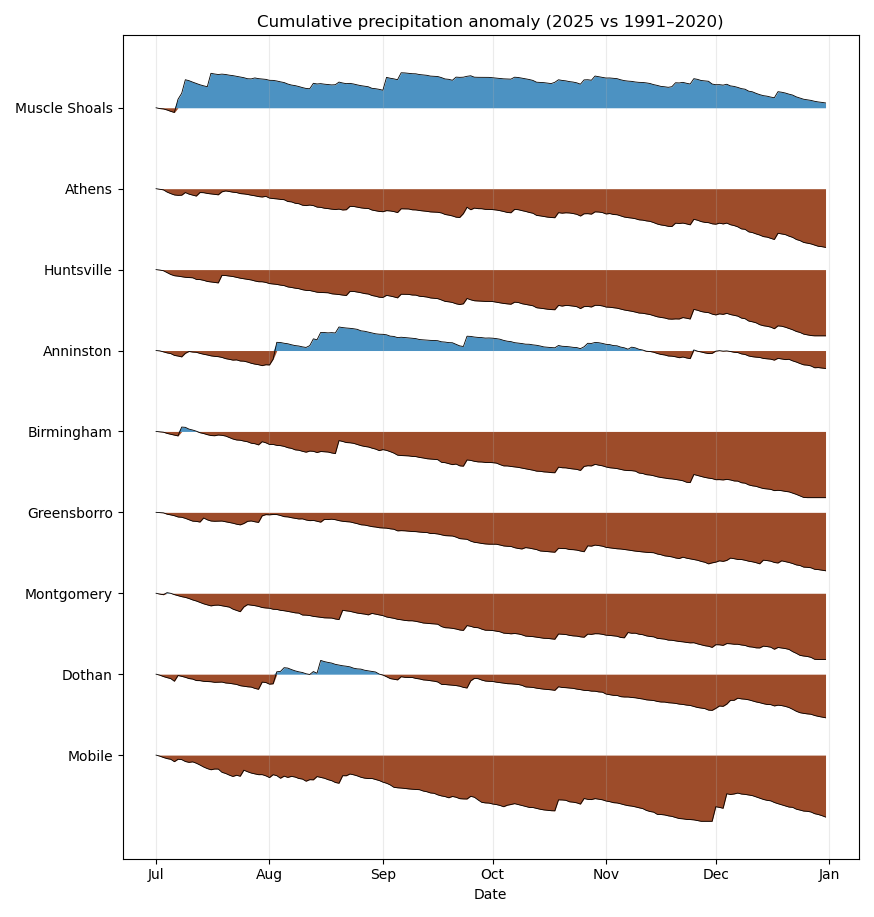
Figure 3 shows cumulative precipitation through the year and how totals compared to long-term normals. Rainfall accumulated steadily through early summer, with a pronounced increase during May, reflecting the wettest May on record statewide. However, precipitation declined sharply beginning in late summer. When viewed from July through December, cumulative rainfall deficits developed rapidly across much of the state, and this six-month period ranked as the second driest such period on record. This July–December view (Figure 4) provides a clear example of how a year that finishes only slightly drier than normal can still include several consecutive months that are much drier than normal, a pattern that can quickly lead to drought conditions.
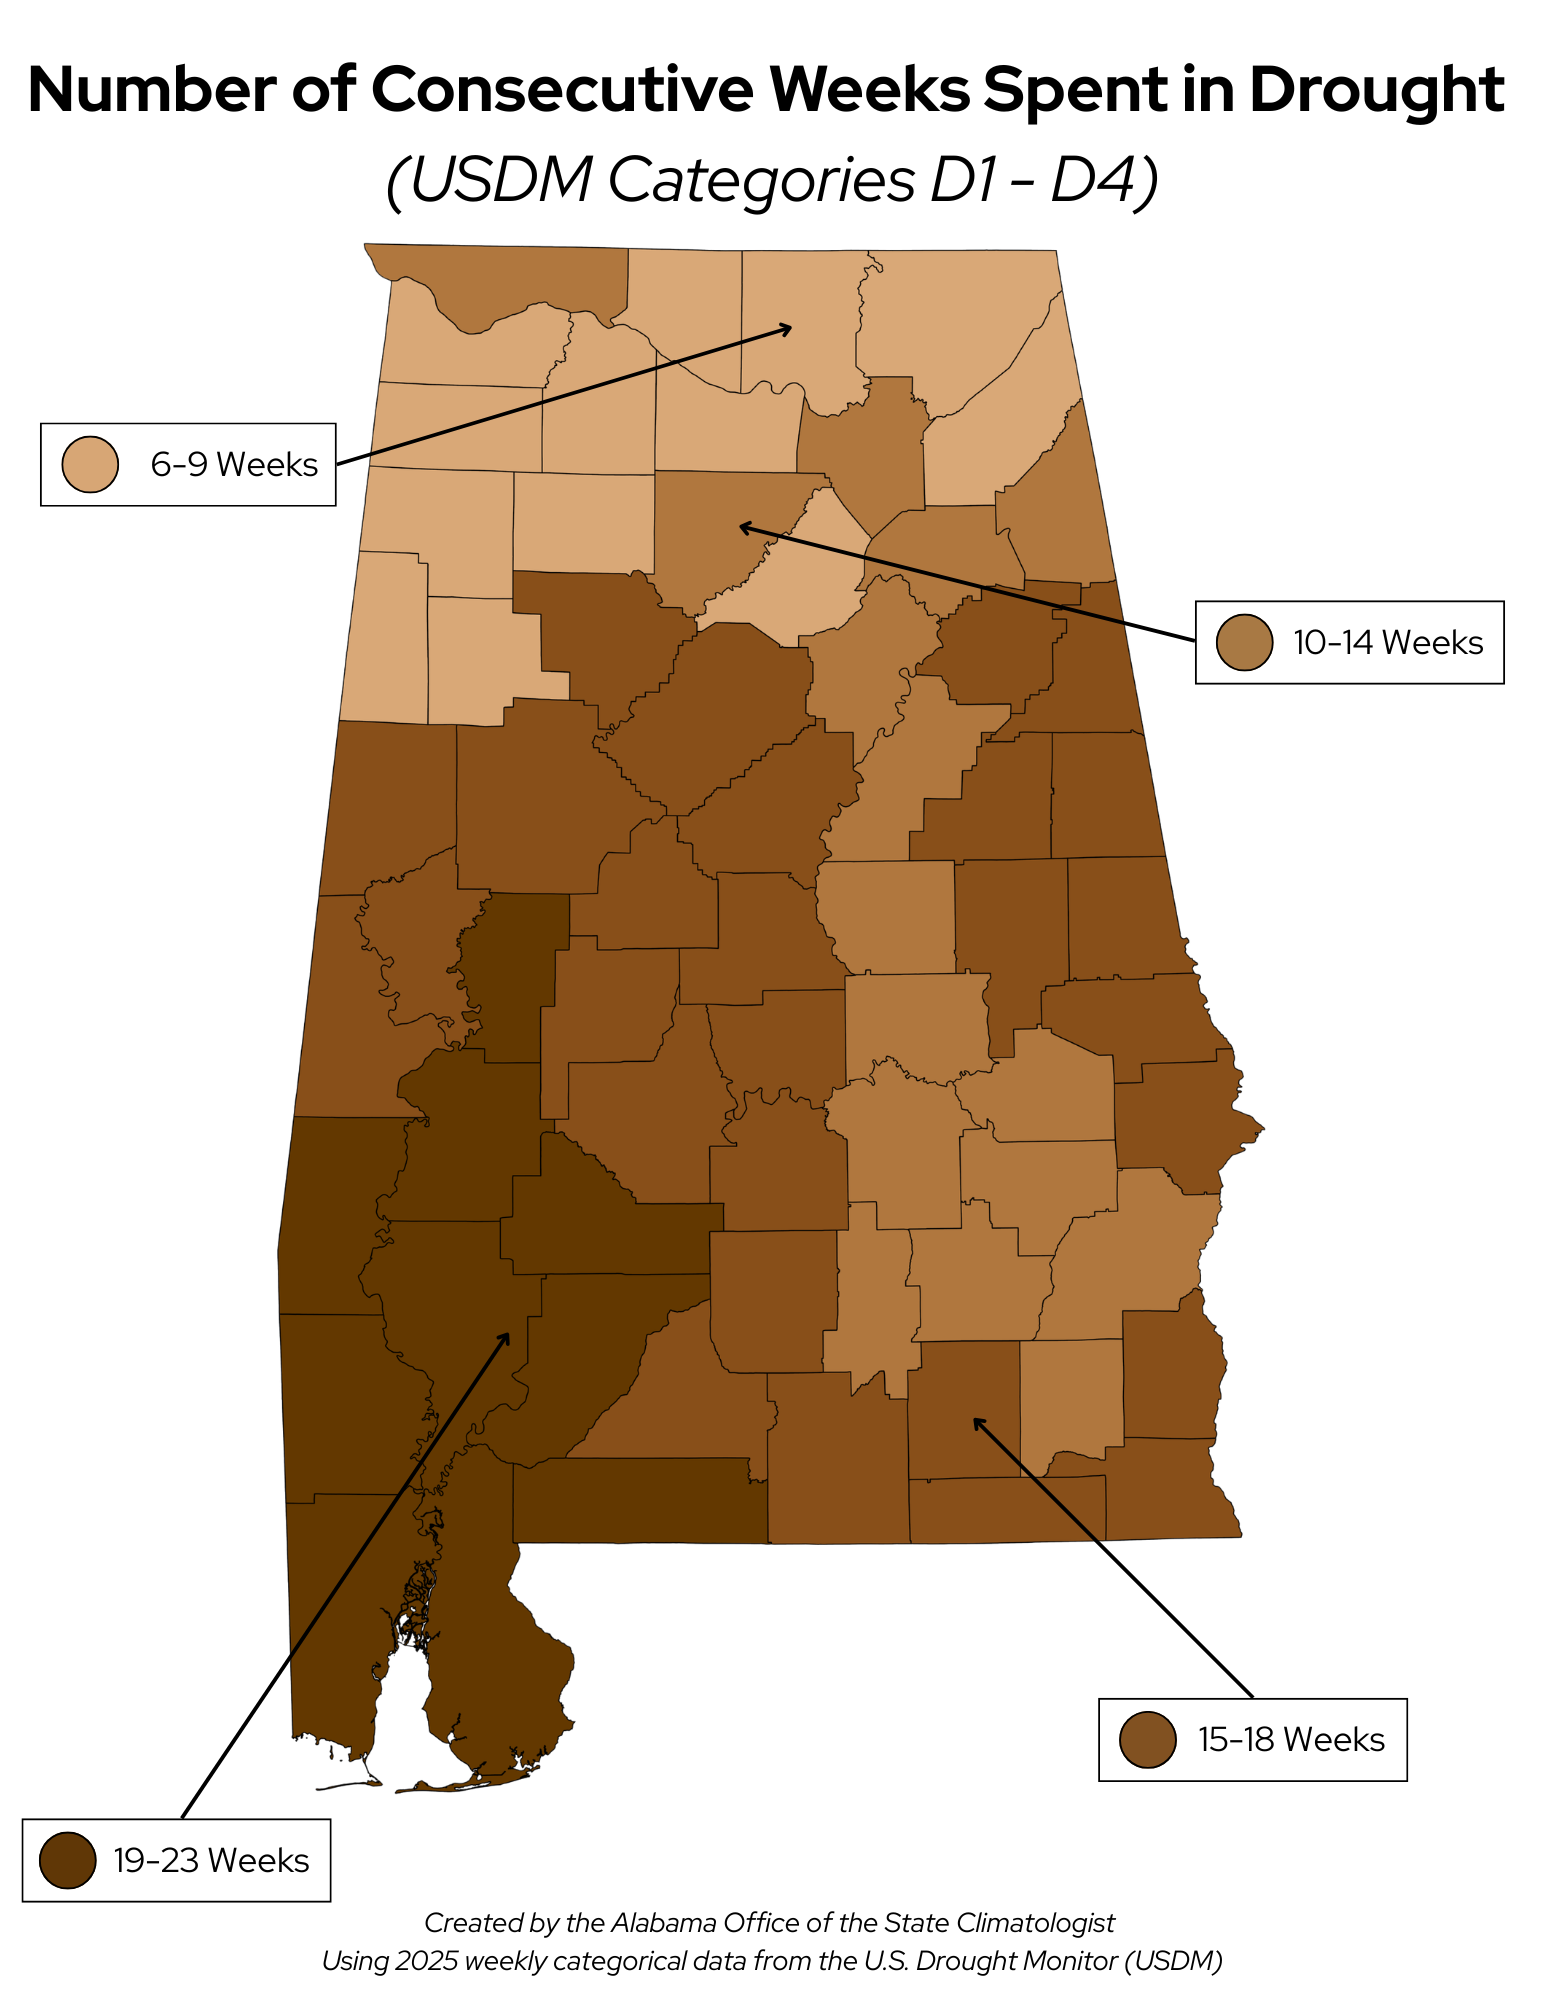
Drought severity varied by county (Figure 5). Hale, Geneva, and Henry Counties each experienced at least one week entirely in Extreme Drought (D3). Clarke County experienced the greatest overall drought duration, with 37 weeks in Moderate to Exceptional Drought. Washington County recorded the longest consecutive drought streak at 23 weeks, and portions of Sumter, Greene, Hale, and Marengo Counties experienced Extreme Drought for 14 weeks. Thirteen counties statewide were in some level of drought for more than half of the year. All drought information is based on the U.S. Drought Monitor. Local observations also support drought assessments, and Alabamians can contribute by submitting Condition Monitoring and Observer Reports (CMOR) to help capture on-the-ground conditions.
Notable Climate Events of 2025
-
January 20–22 Gulf Coast blizzard
A historic winter storm impacted Alabama in late January, bringing snow, ice, and bitterly cold temperatures to much of the state, including areas along the Gulf Coast. Snowfall totals during this event set all-time records at several locations in South Alabama, making it one of the most significant winter weather events on record for the region.
-
All-time snowfall records
The January winter storm set new snowfall records at multiple observing stations, including Fairhope, Brewton, Geneva, Atmore, Headland, Dothan Regional Airport, and Mobile Regional Airport. Snowfall totals ranged from 5 to 7.5 inches, with some records dating back more than 70 years.
-
Wettest May on statewide record
May brought widespread and persistent rainfall across Alabama, resulting in the wettest May on record statewide. This rainfall provided short-term drought relief, replenished soil moisture, and benefited agriculture and water resources across much of the state.
-
All-time daily rainfall records
Heavy rainfall events set new daily records at several locations. Muscle Shoals recorded 6.01 inches of rain on March 15, marking the highest daily total on record there (period of record beginning in 1893). Fayette received 9.27 inches of rain on May 13, setting a new all-time daily rainfall record dating back to 1892.
-
Active tornado season
Alabama experienced an active tornado season in 2025, with 72 tornadoes reported statewide, well above the long-term annual average of around 50. Tornado activity was especially notable in March (20 tornadoes) and May (23 tornadoes), reinforcing that severe weather remains a year-round concern across the state.
2026 Outlook
Climate outlooks from the National Oceanic and Atmospheric Administration Climate Prediction Center (NOAA CPC) suggest that drought is likely to persist through spring. South Alabama has a higher probability of warmer-than-average temperatures, while the rest of the state has varying chances of above-normal warmth. The southern half of the state is also favored to be drier than normal, a combination that could compound ongoing dry conditions in many areas.
Drought continues to affect communities across the state, and while improvements are possible with timely rainfall, it may take sustained precipitation to see meaningful relief. Adding to the complexity of early-year conditions, many areas experienced severe cold temperatures, along with light snow and ice, in late January. More details on this cold snap and its impacts will be included in the January 2026 Alabama Climate Report, which will be published by mid-February.
You can stay up to date on evolving conditions by reading our monthly Alabama Climate Reports and signing up for our monthly newsletter, where we share timely updates, context, and insights on Alabama’s climate throughout the year.