Written by: Brianne Minton
With Technical Expertise From: Dr. Lee Ellenburg & Dr. Rob Junod
Each spring, the same question comes up across Alabama: When is it safe to plant? Whether you are a farmer, a home gardener, or just ready to refresh your landscape, timing matters. Plant too early, and a late cold snap could damage new growth. Plant too late, and you may miss part of the growing season and part of spring rains. That is where two important weather markers come in: the last freeze date and the last frost date.
On average, the Gulf Coast sees its final freeze and frost first, followed by South, Central, and then North Alabama, with higher elevations typically experiencing the latest dates. Risk levels vary depending on how cautious you choose to be, and historical records show that freezes have occurred into late April and even May in some locations, with frost occasionally extending into early June. As the season changes, it is important to monitor short-term forecasts and stay updated with your local National Weather Service office, which often issues Freeze Warnings and Frost Advisories when conditions warrant. For guidance on protecting plants and preparing for freeze and frost conditions, we encourage you to contact your local Alabama Extension office for information tailored to your specific area and growing needs. If you have questions about this data, feel free to reach out to the Alabama Office of the State Climatologist at aosc@uah.edu. Read on for a closer look at how these last freeze and last frost dates vary across the state and how they have changed over time.
What is Freeze and Frost?
Before we look at the dates themselves, it helps to understand the difference between a frost and a freeze. Frost forms when water vapor comes into contact with a surface that is at or below 32°F and creates a delicate layer of ice crystals. For this to happen, there must be enough moisture in the air and the surface of the soil or plant must be freezing. This occurs when the air cools to its dew point and that dew point is at or below 32°F. At that point, the air is saturated, meaning relative humidity is 100%, and water vapor changes directly into delicate ice crystals on cold surfaces. Clear skies, light winds, and cold air create ideal conditions for this process. Frost can even form on the ground when your thermometer reads slightly above freezing, because most thermometers measure temperature 2 meters above the surface and may not capture the colder air settling right at ground level. While frost may not disrupt travel or infrastructure, it can damage flowers, vegetables, fruit trees, and other cold-sensitive plants, especially early in the growing season. For farmers, gardeners, and landscapers, even a brief frost can mean covering plants, delaying planting, or facing crop loss.
A freeze is different. A freeze occurs when the air temperature reaches 32°F or colder several feet above the ground. This usually happens when a denser, colder air mass moves into the area. Because the entire layer of air near the surface is at or below freezing, freezes often affect a wider area and can cause more widespread damage to plants. A light freeze may briefly dip to 32°F, while a hard freeze occurs when temperatures fall well below freezing (28°F) for at least one hour. Hard freezes can damage or even end the growing season for many crops and sensitive plants. Freezes are also more likely to impact daily life, sometimes affecting exposed pipes, road conditions, or travel. Because frost and freeze form in different ways and have different impacts, it is important that we track both.
The average last frost date and last freeze date are based on our past climate. They represent the typical final frost or freeze of the spring season. However, they are not guarantees. Weather varies from year to year, and cold events can still occur after these average dates. Instead, these markers help us estimate when the risk of damaging cold becomes much lower.
In the sections below, we will look at how last frost and last freeze dates vary across Alabama and what those patterns mean for spring planning.
Average Last Freeze and Frost Dates
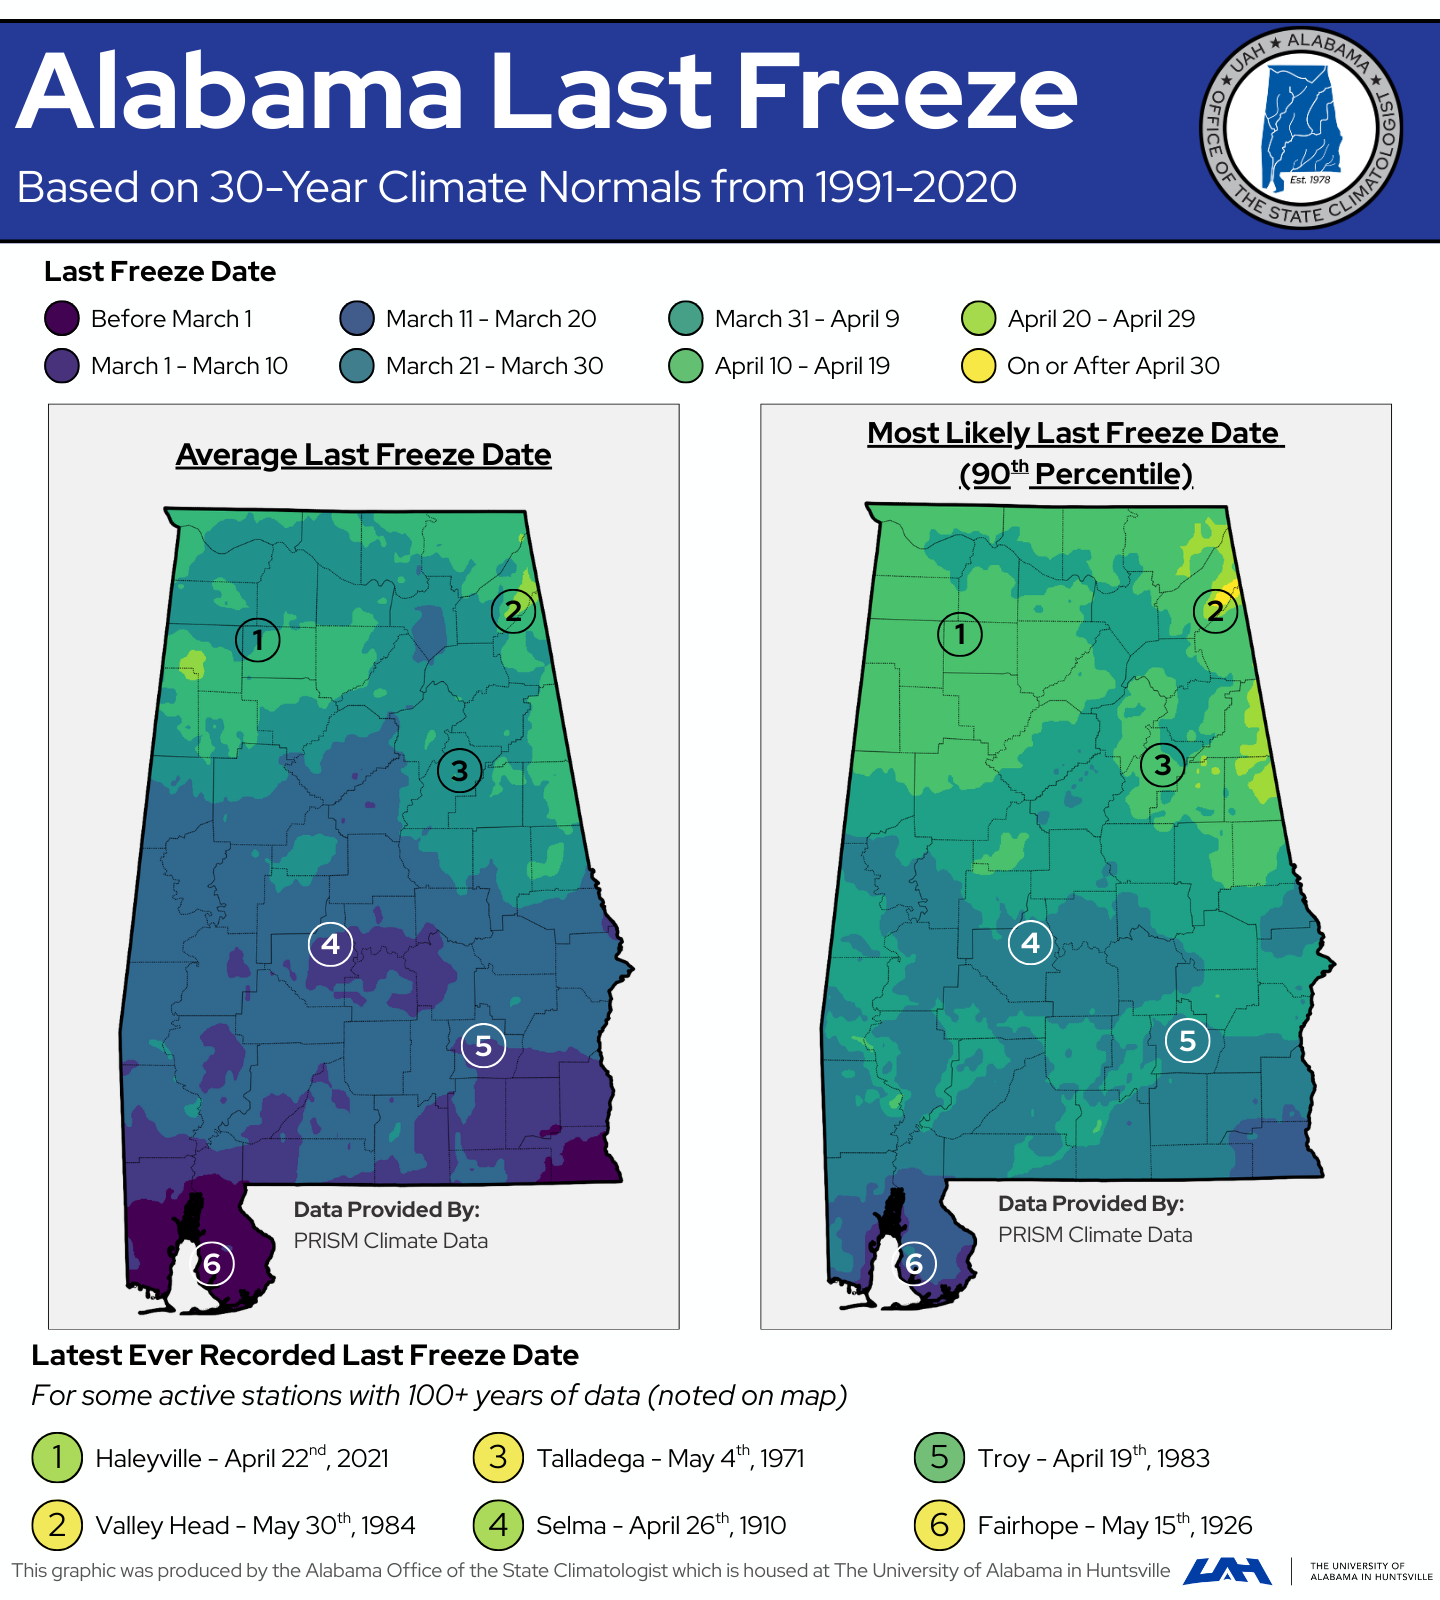
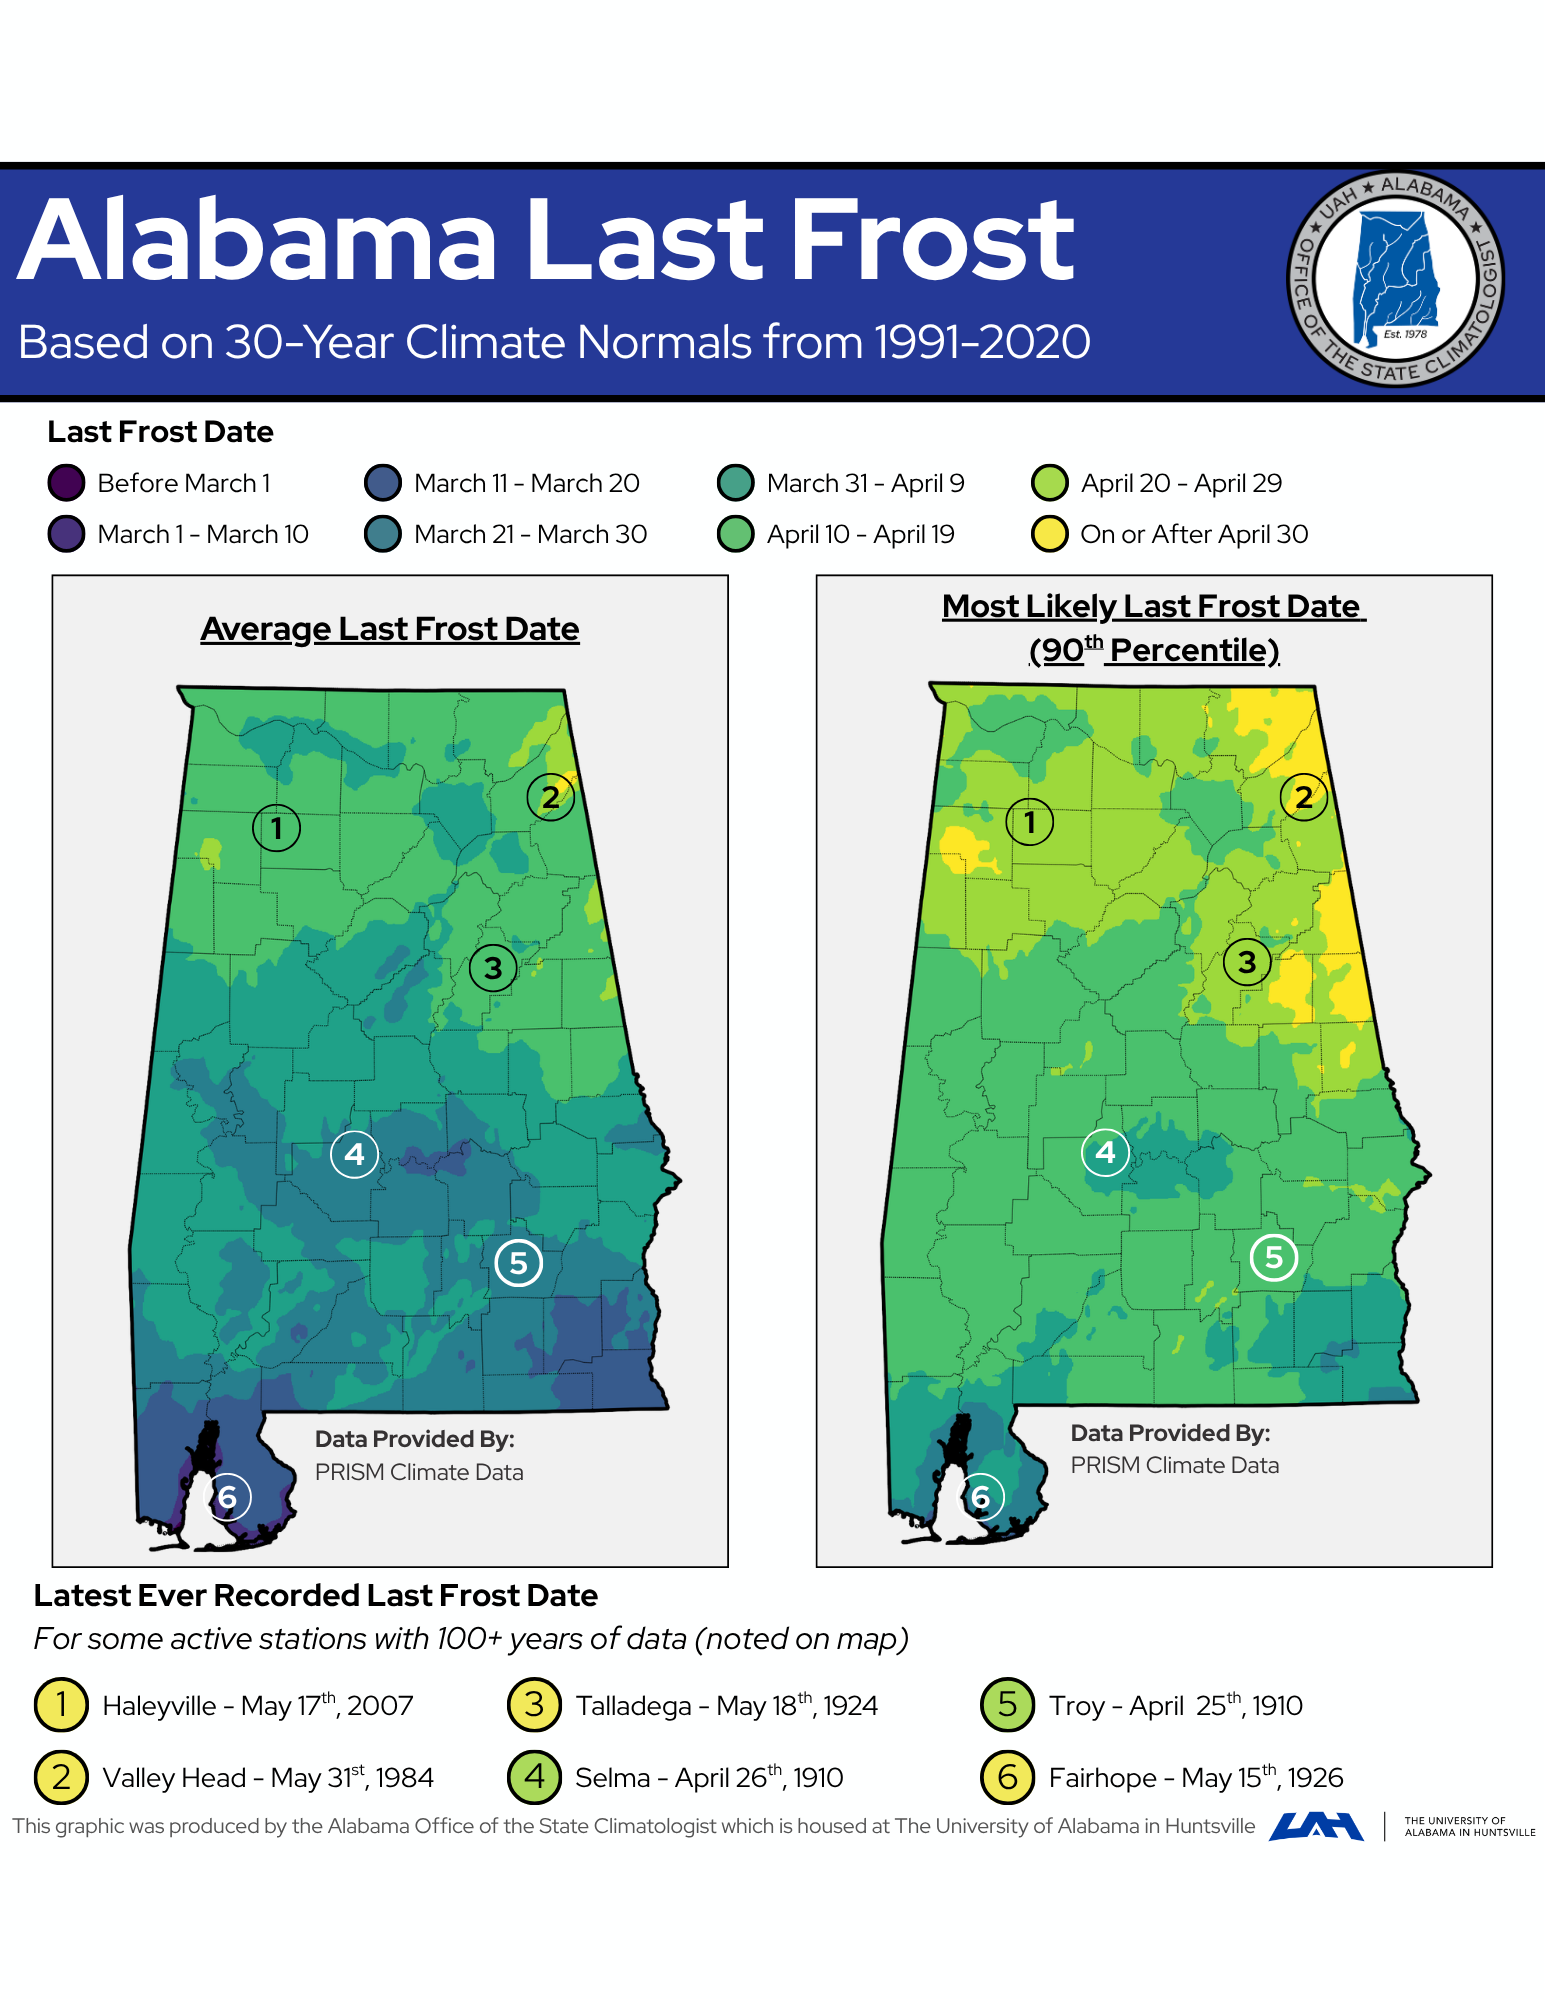
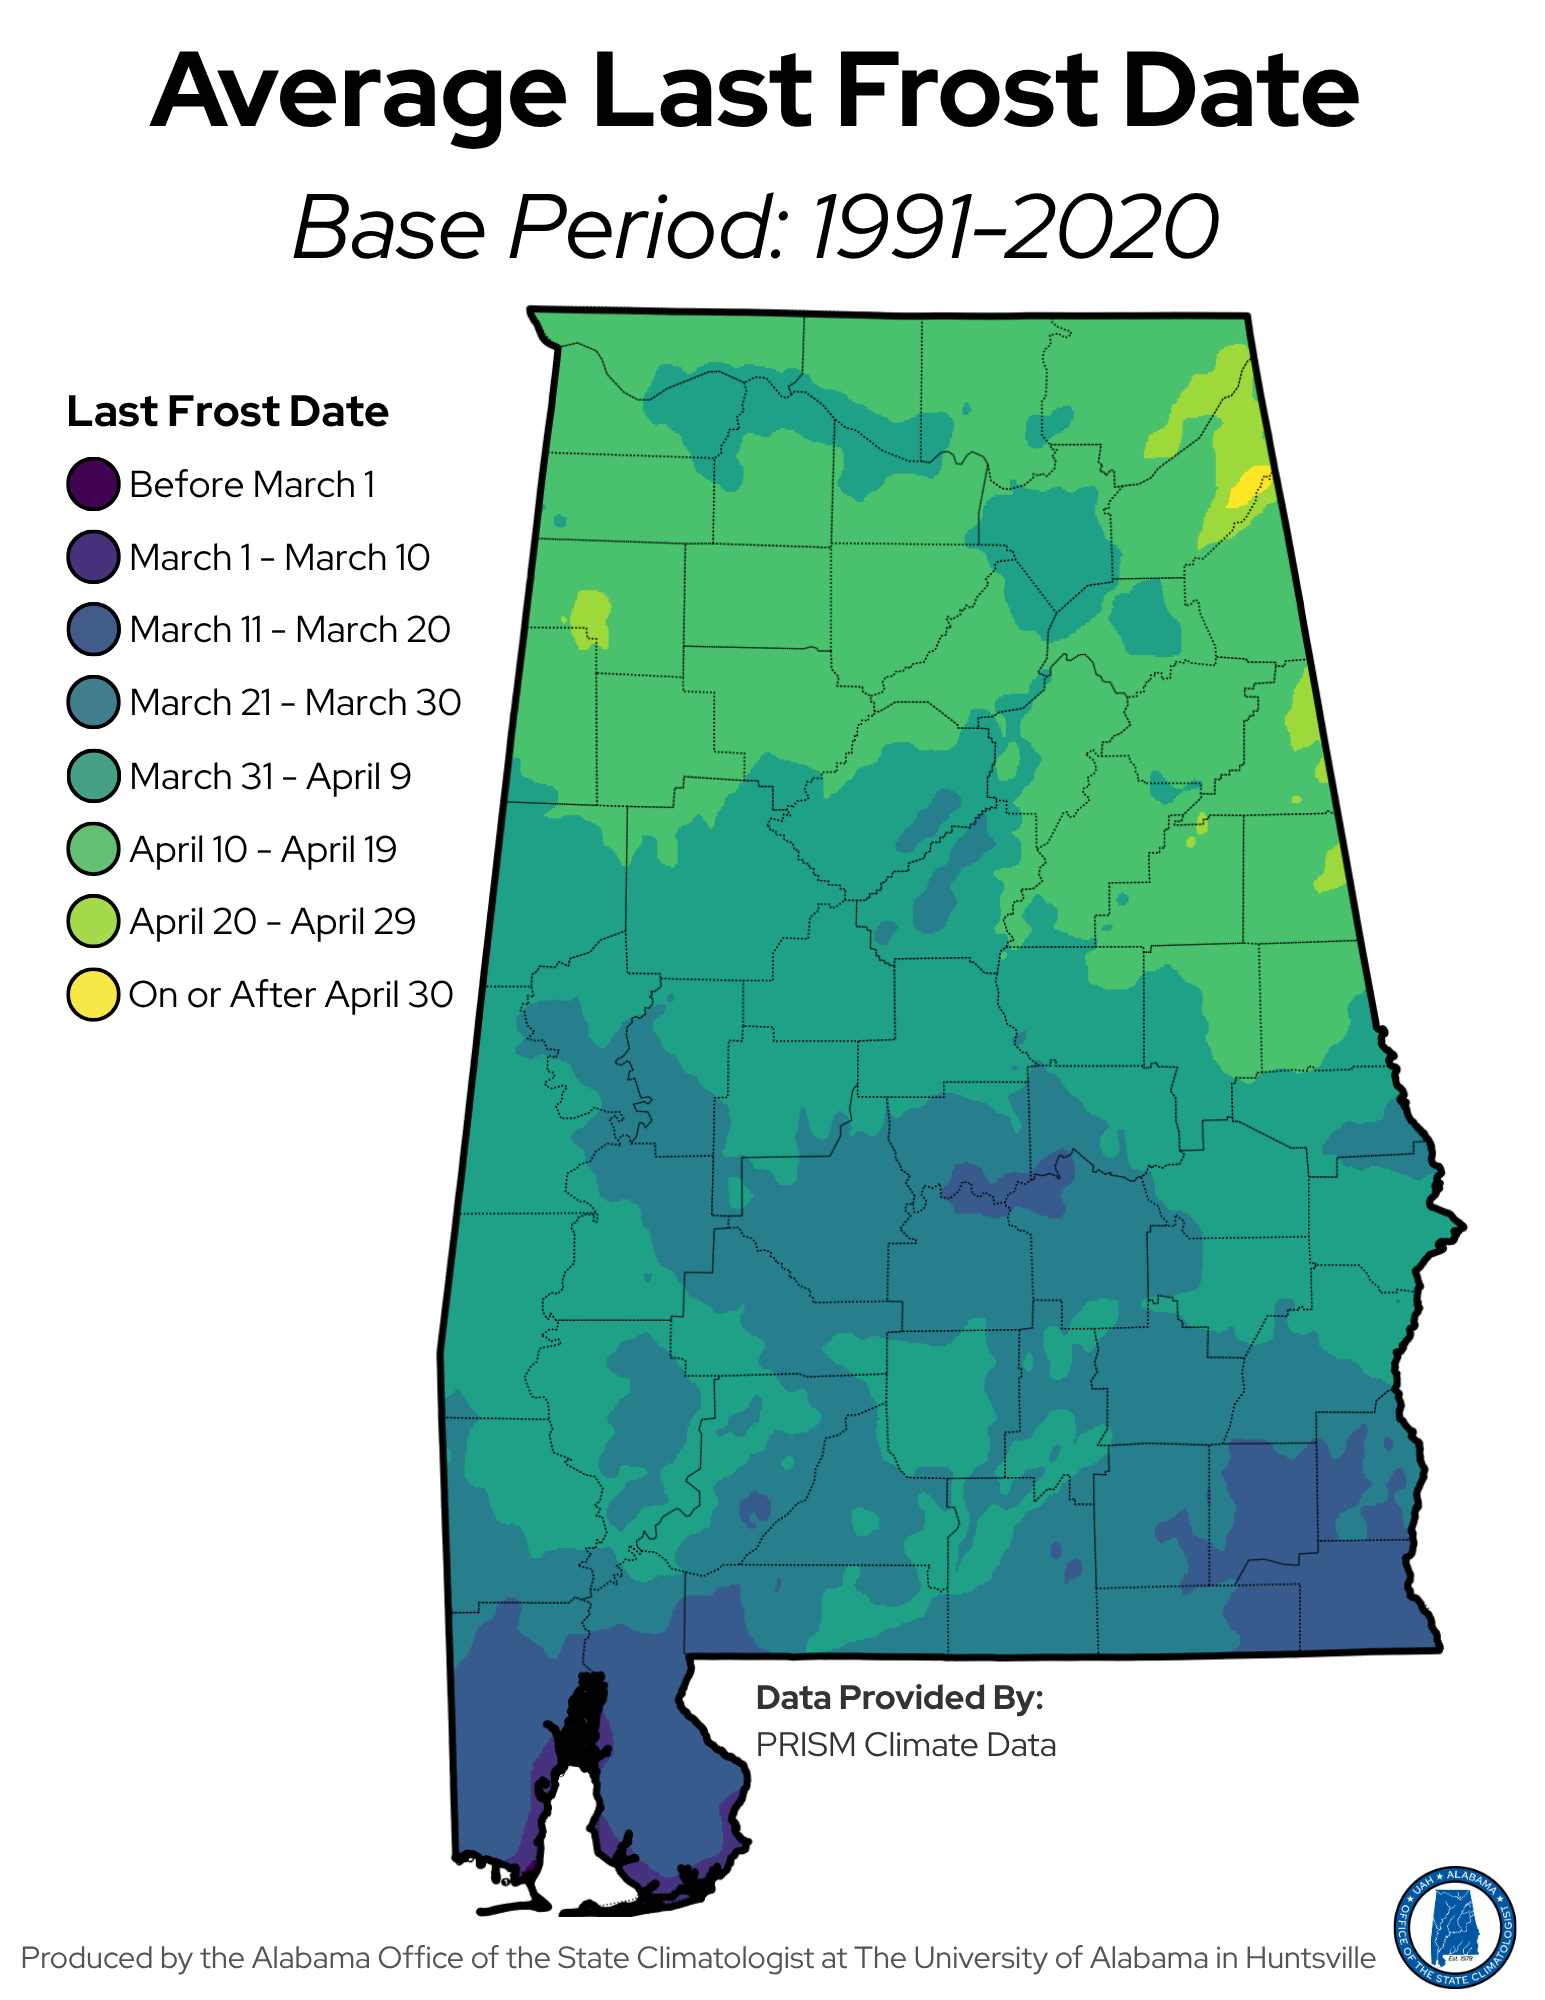
Figures 3 and 4 show the average last freeze and average last frost dates across Alabama using PRISM weather data from 1991–2020, representing typical conditions over the past 30 years (we call this our “Climate Normal”) . When we say “average,” it means there is about a 50% chance that a frost or freeze will not occur after the date shown. These maps are helpful planning tools, but they are not guarantees.
As expected, there is a clear latitudinal pattern across the state. Most of the state experiences their last freeze in the month of March and their last frost by mid-April, but there are some notable exceptions. Areas along the coast and Southeast Alabama can be nearly a month ahead while areas of higher elevation, especially near Lookout Mountain and DeSoto State Park, tend to see the latest last freeze and frost dates on average.
The maps also highlight smaller pockets of difference across the state. In the corner of Lamar and Marion counties, for example, there is an area that tends to experience a later last freeze and frost than surrounding counties. Meanwhile, parts of northern Lowndes and Montgomery counties along the Alabama River often see earlier last freeze and frost dates than nearby areas. These are examples of microclimates, where local terrain, water bodies, and elevation can influence temperatures (in this case freezing temperatures).
Frosts and freezes can and do occur after the average last date. A strong reminder that these averages are guidelines, not guarantees, occurred during the week of April 4–10, 2007. Known as the Easter Freeze, many parts of North and Central Alabama and as far south as Selma recorded freezing temperatures well beyond the average last freeze date. Huntsville recorded its record minimum temperature for April 7th at 25 degrees, and Gadsden recorded nearly 20 consecutive hours below freezing. March had been pleasantly warm that year, which encouraged early blooming across much of the state. The hard freeze in April resulted in significant agricultural losses. While a hard early April freeze is not common climatologically for most of Alabama, 2007 illustrates how relying solely on the average date does not eliminate risk.

Understanding Risk: 75th and 90th Percentiles
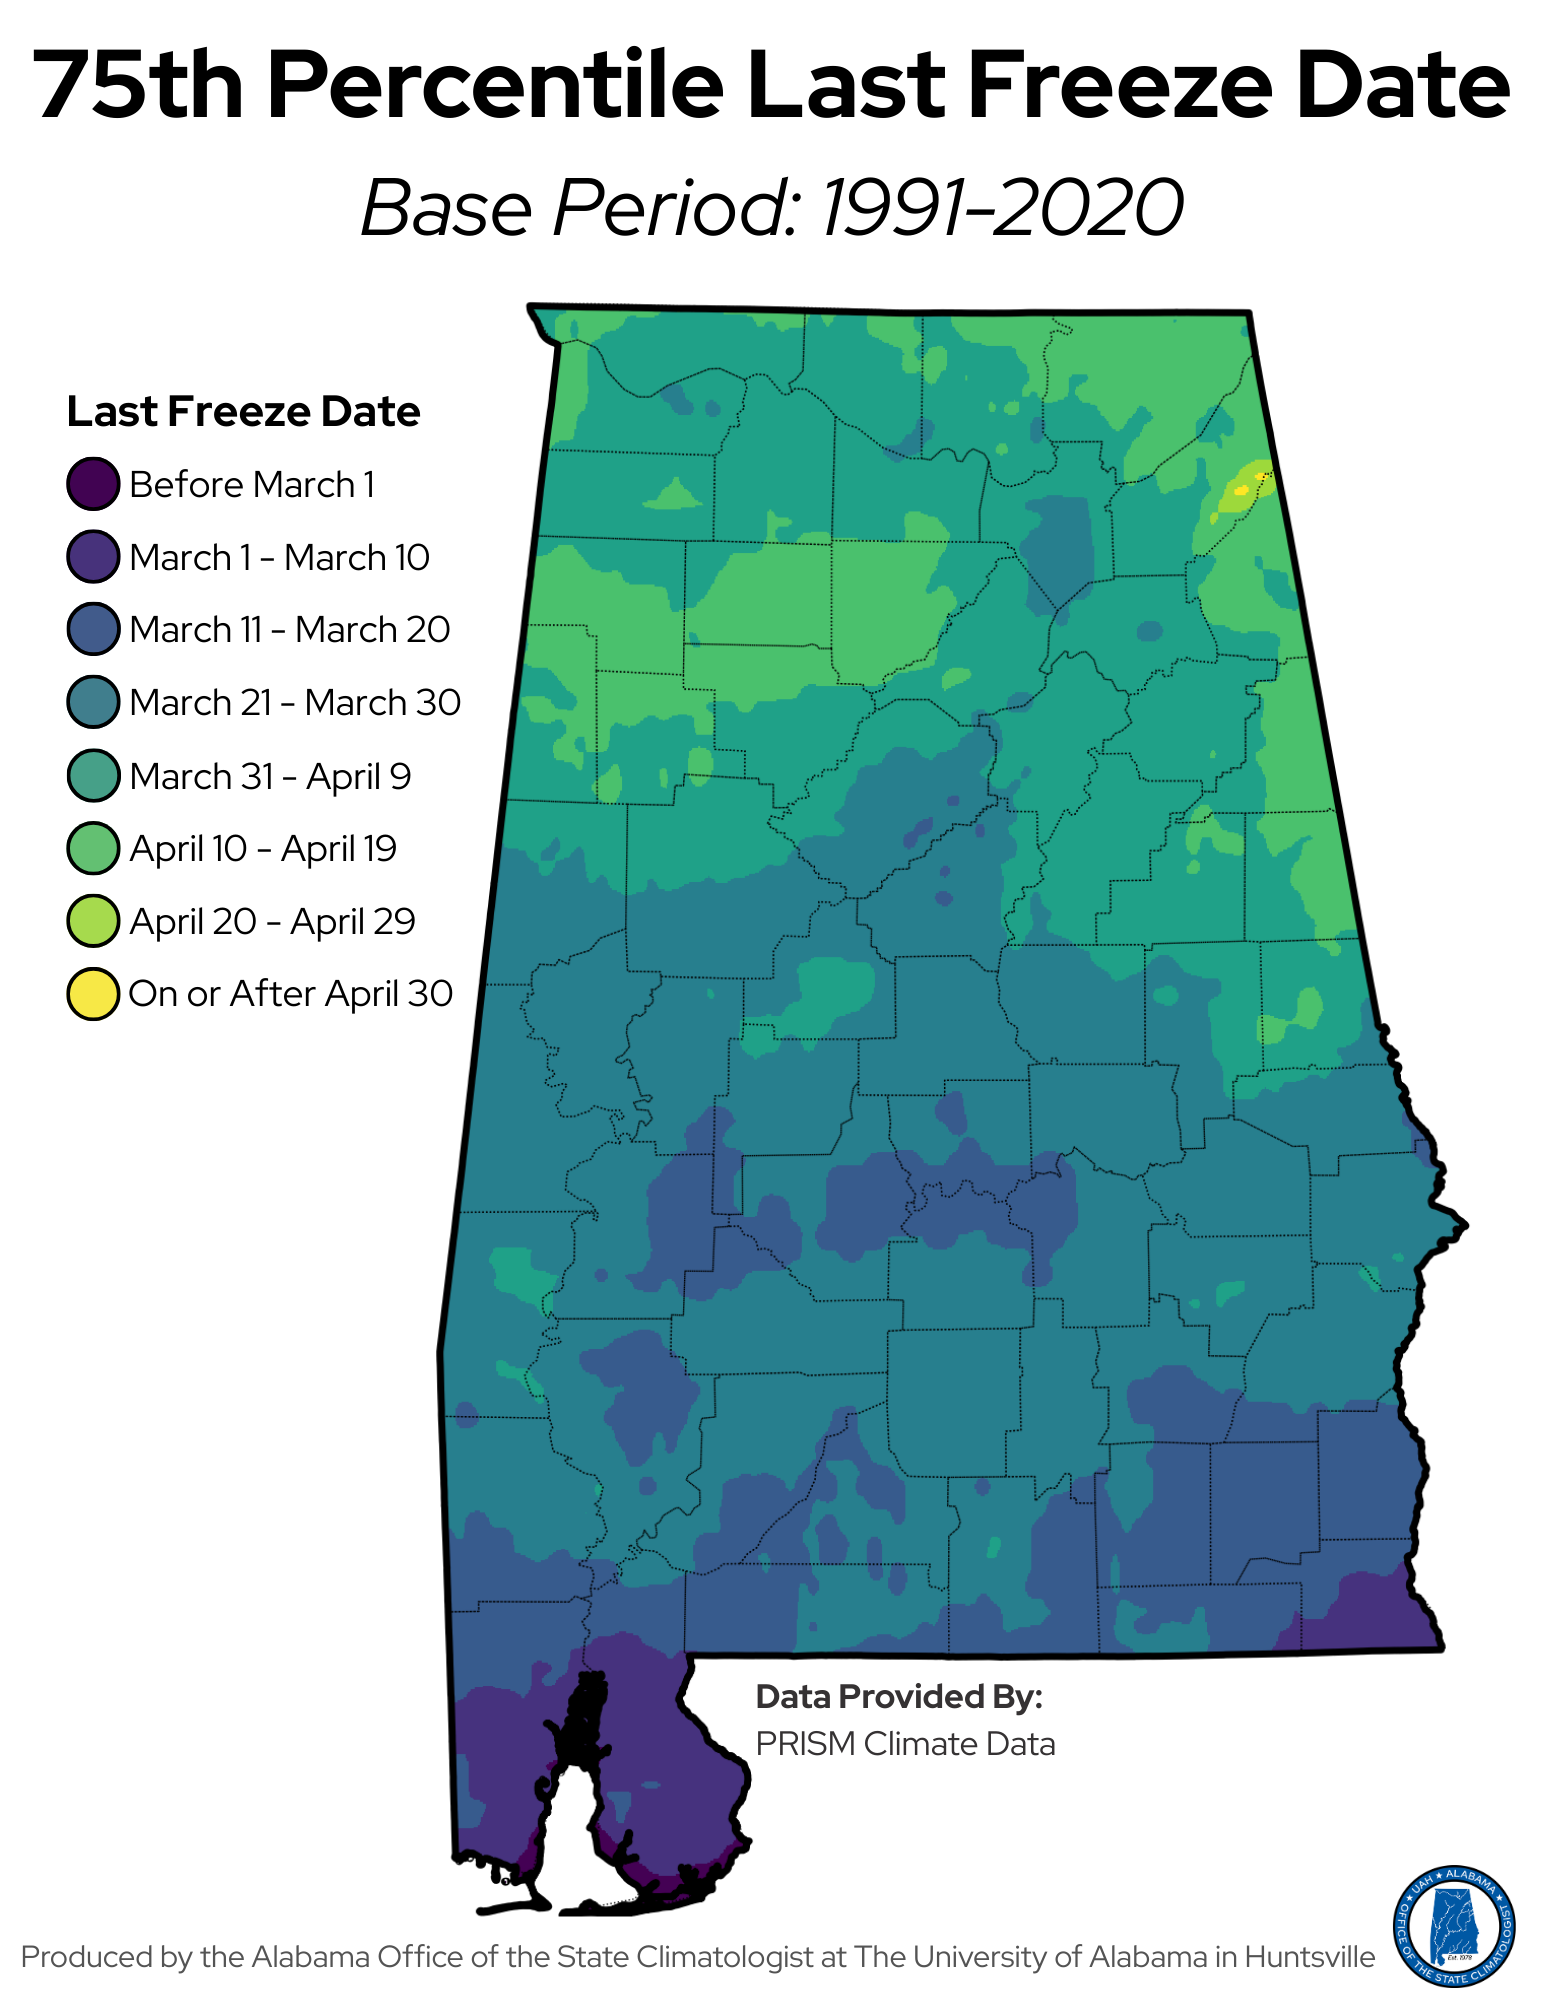
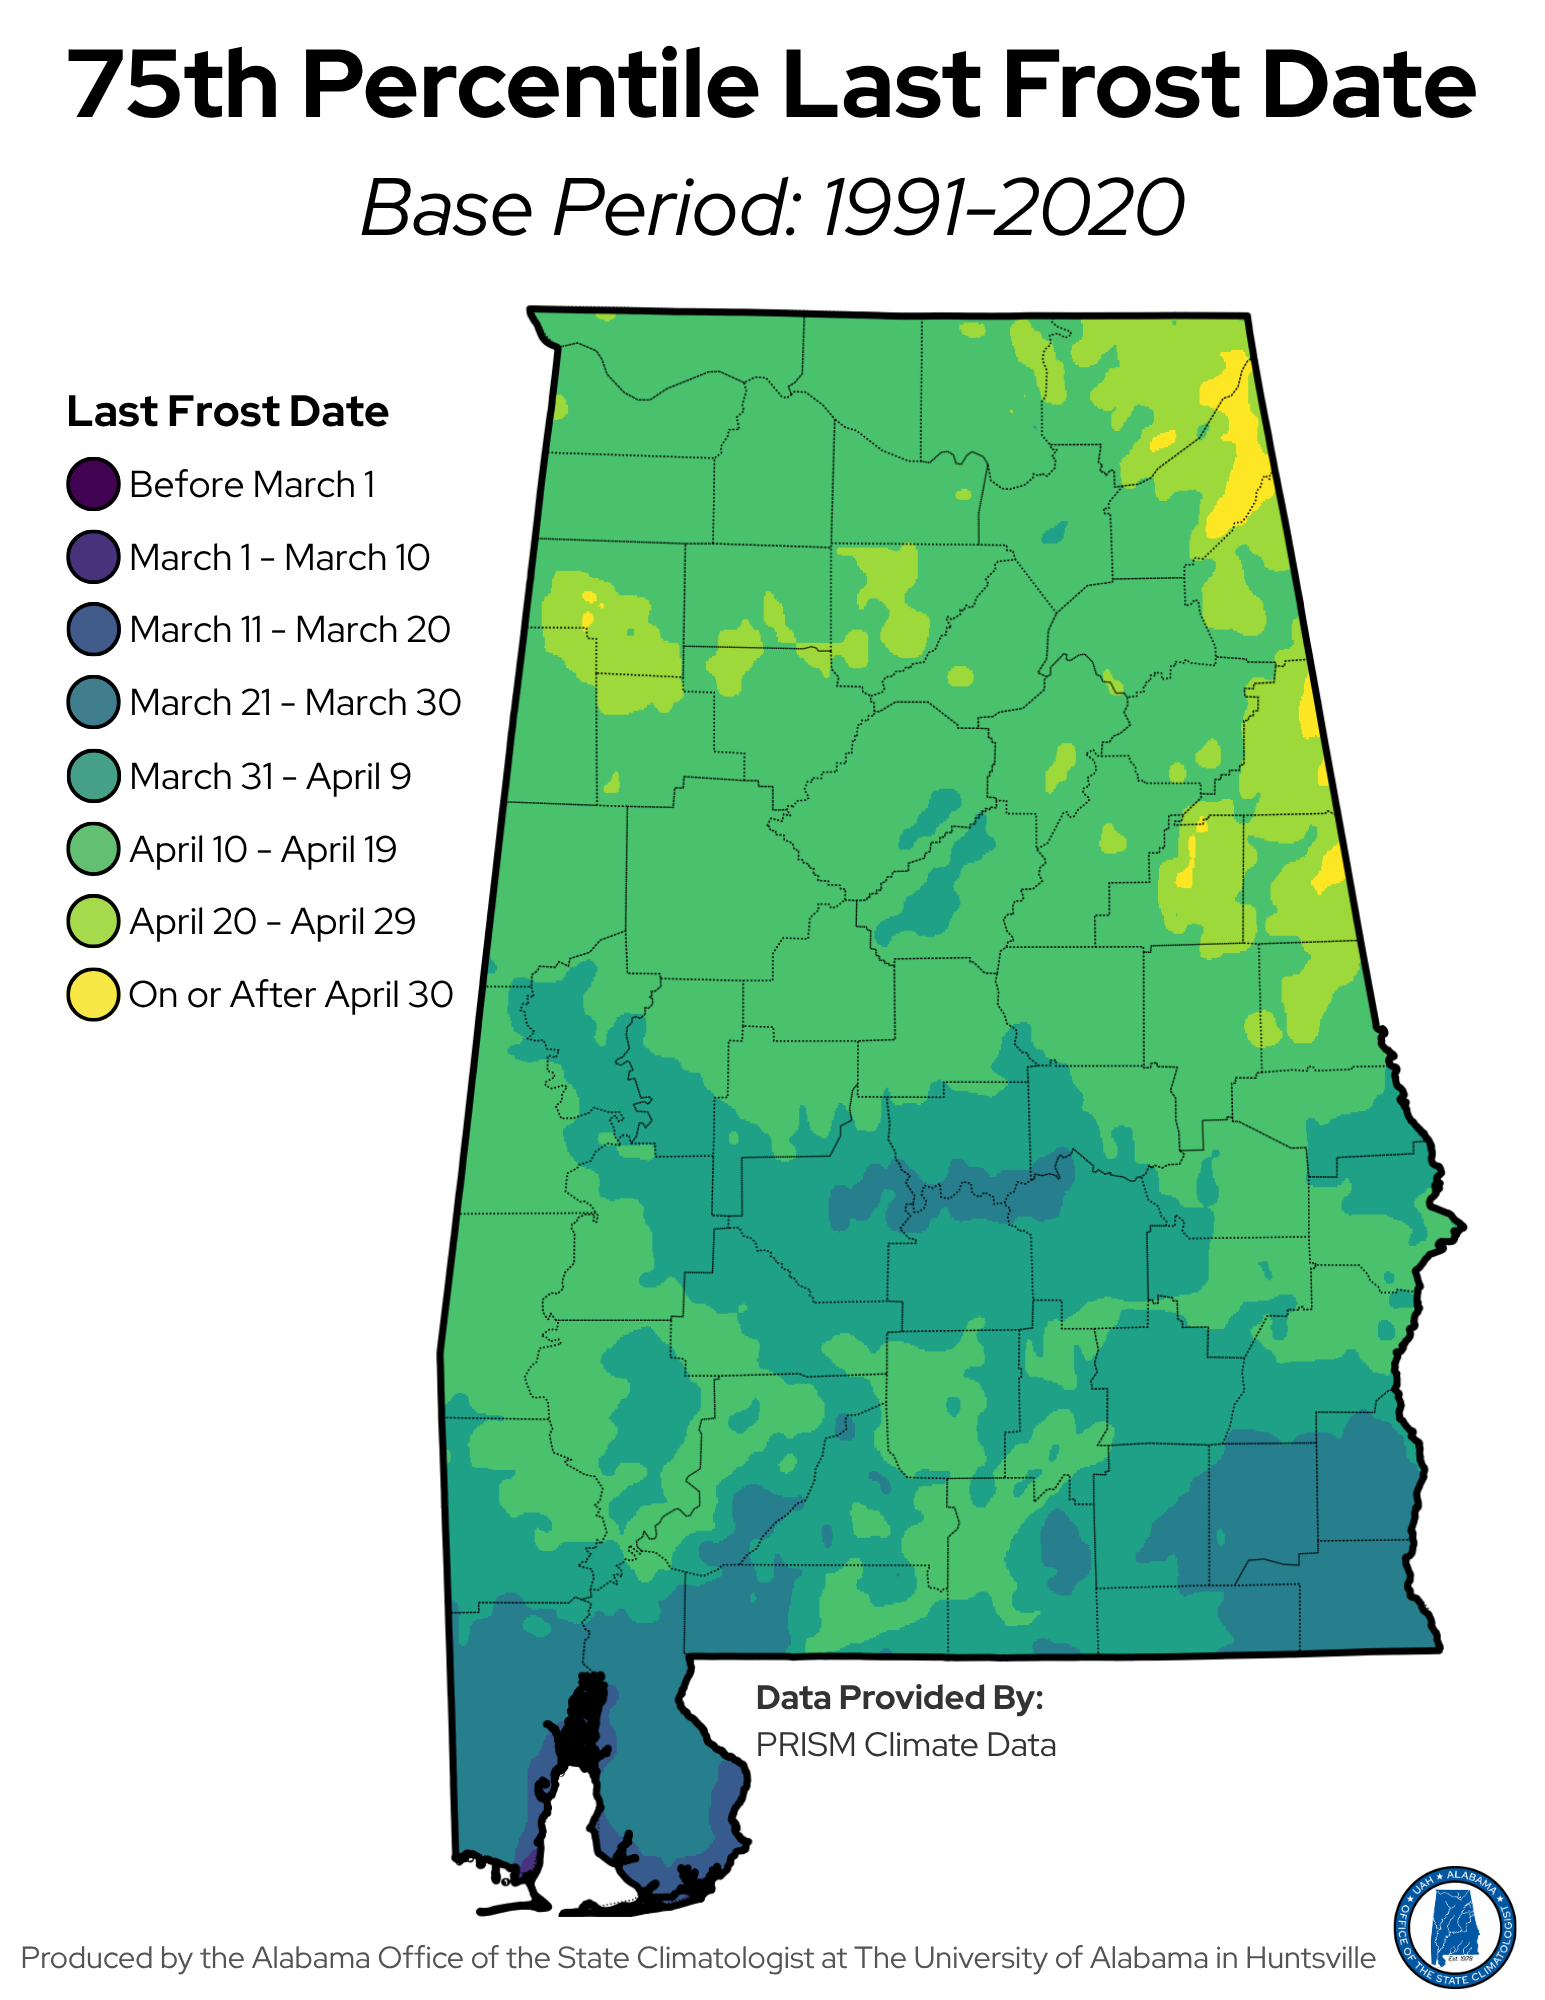
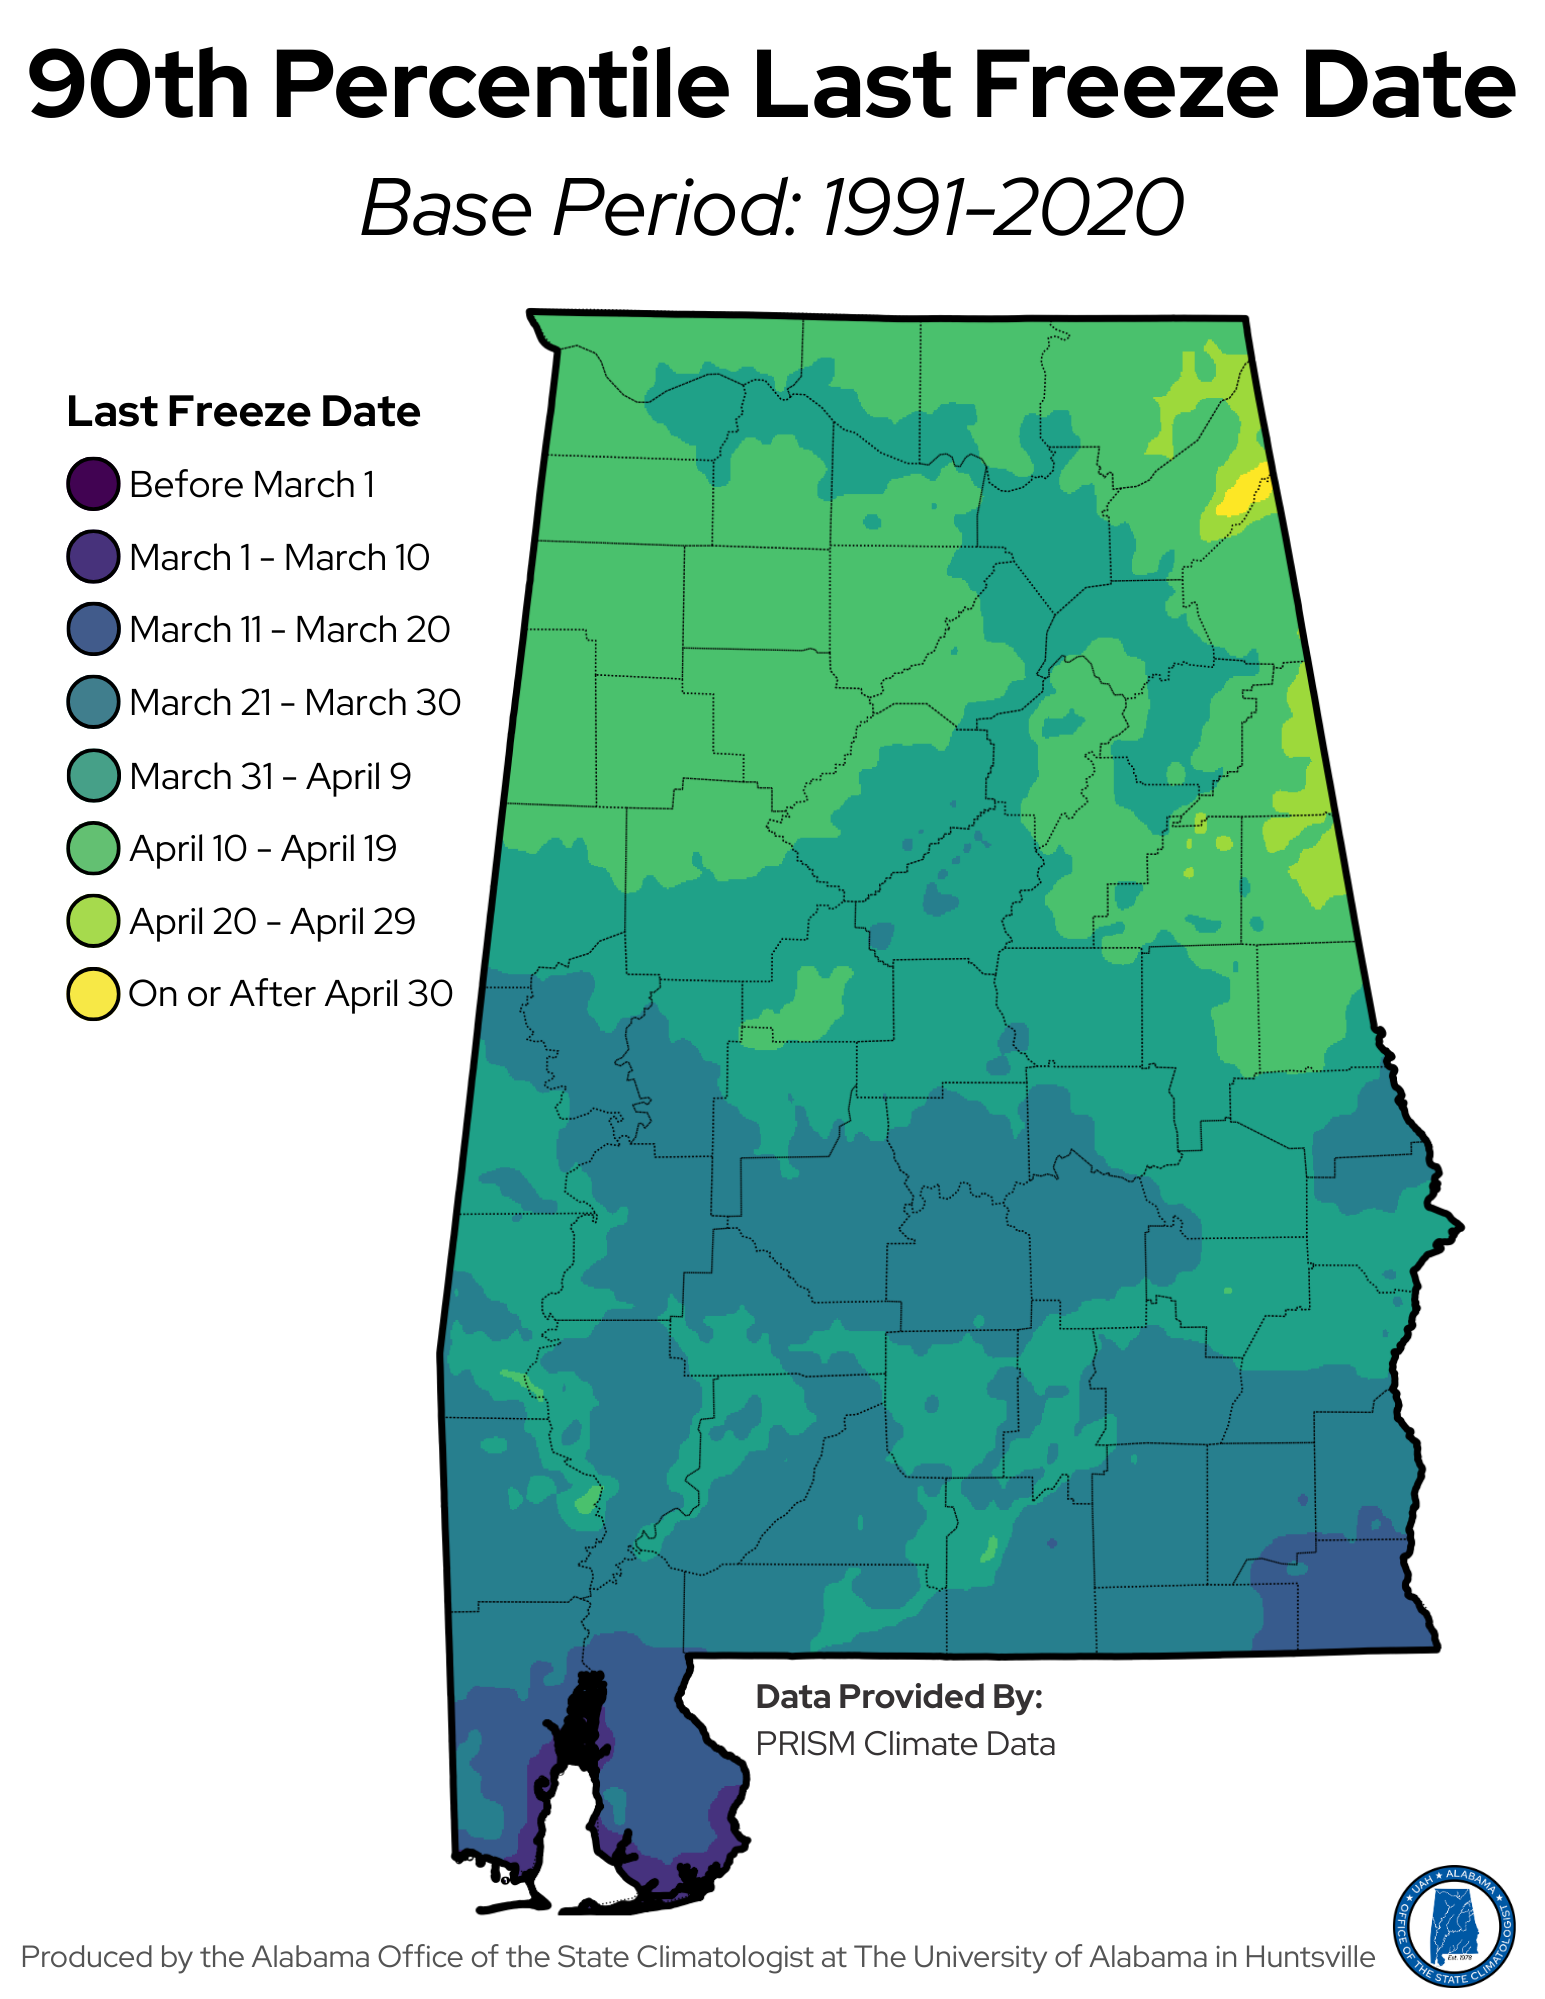
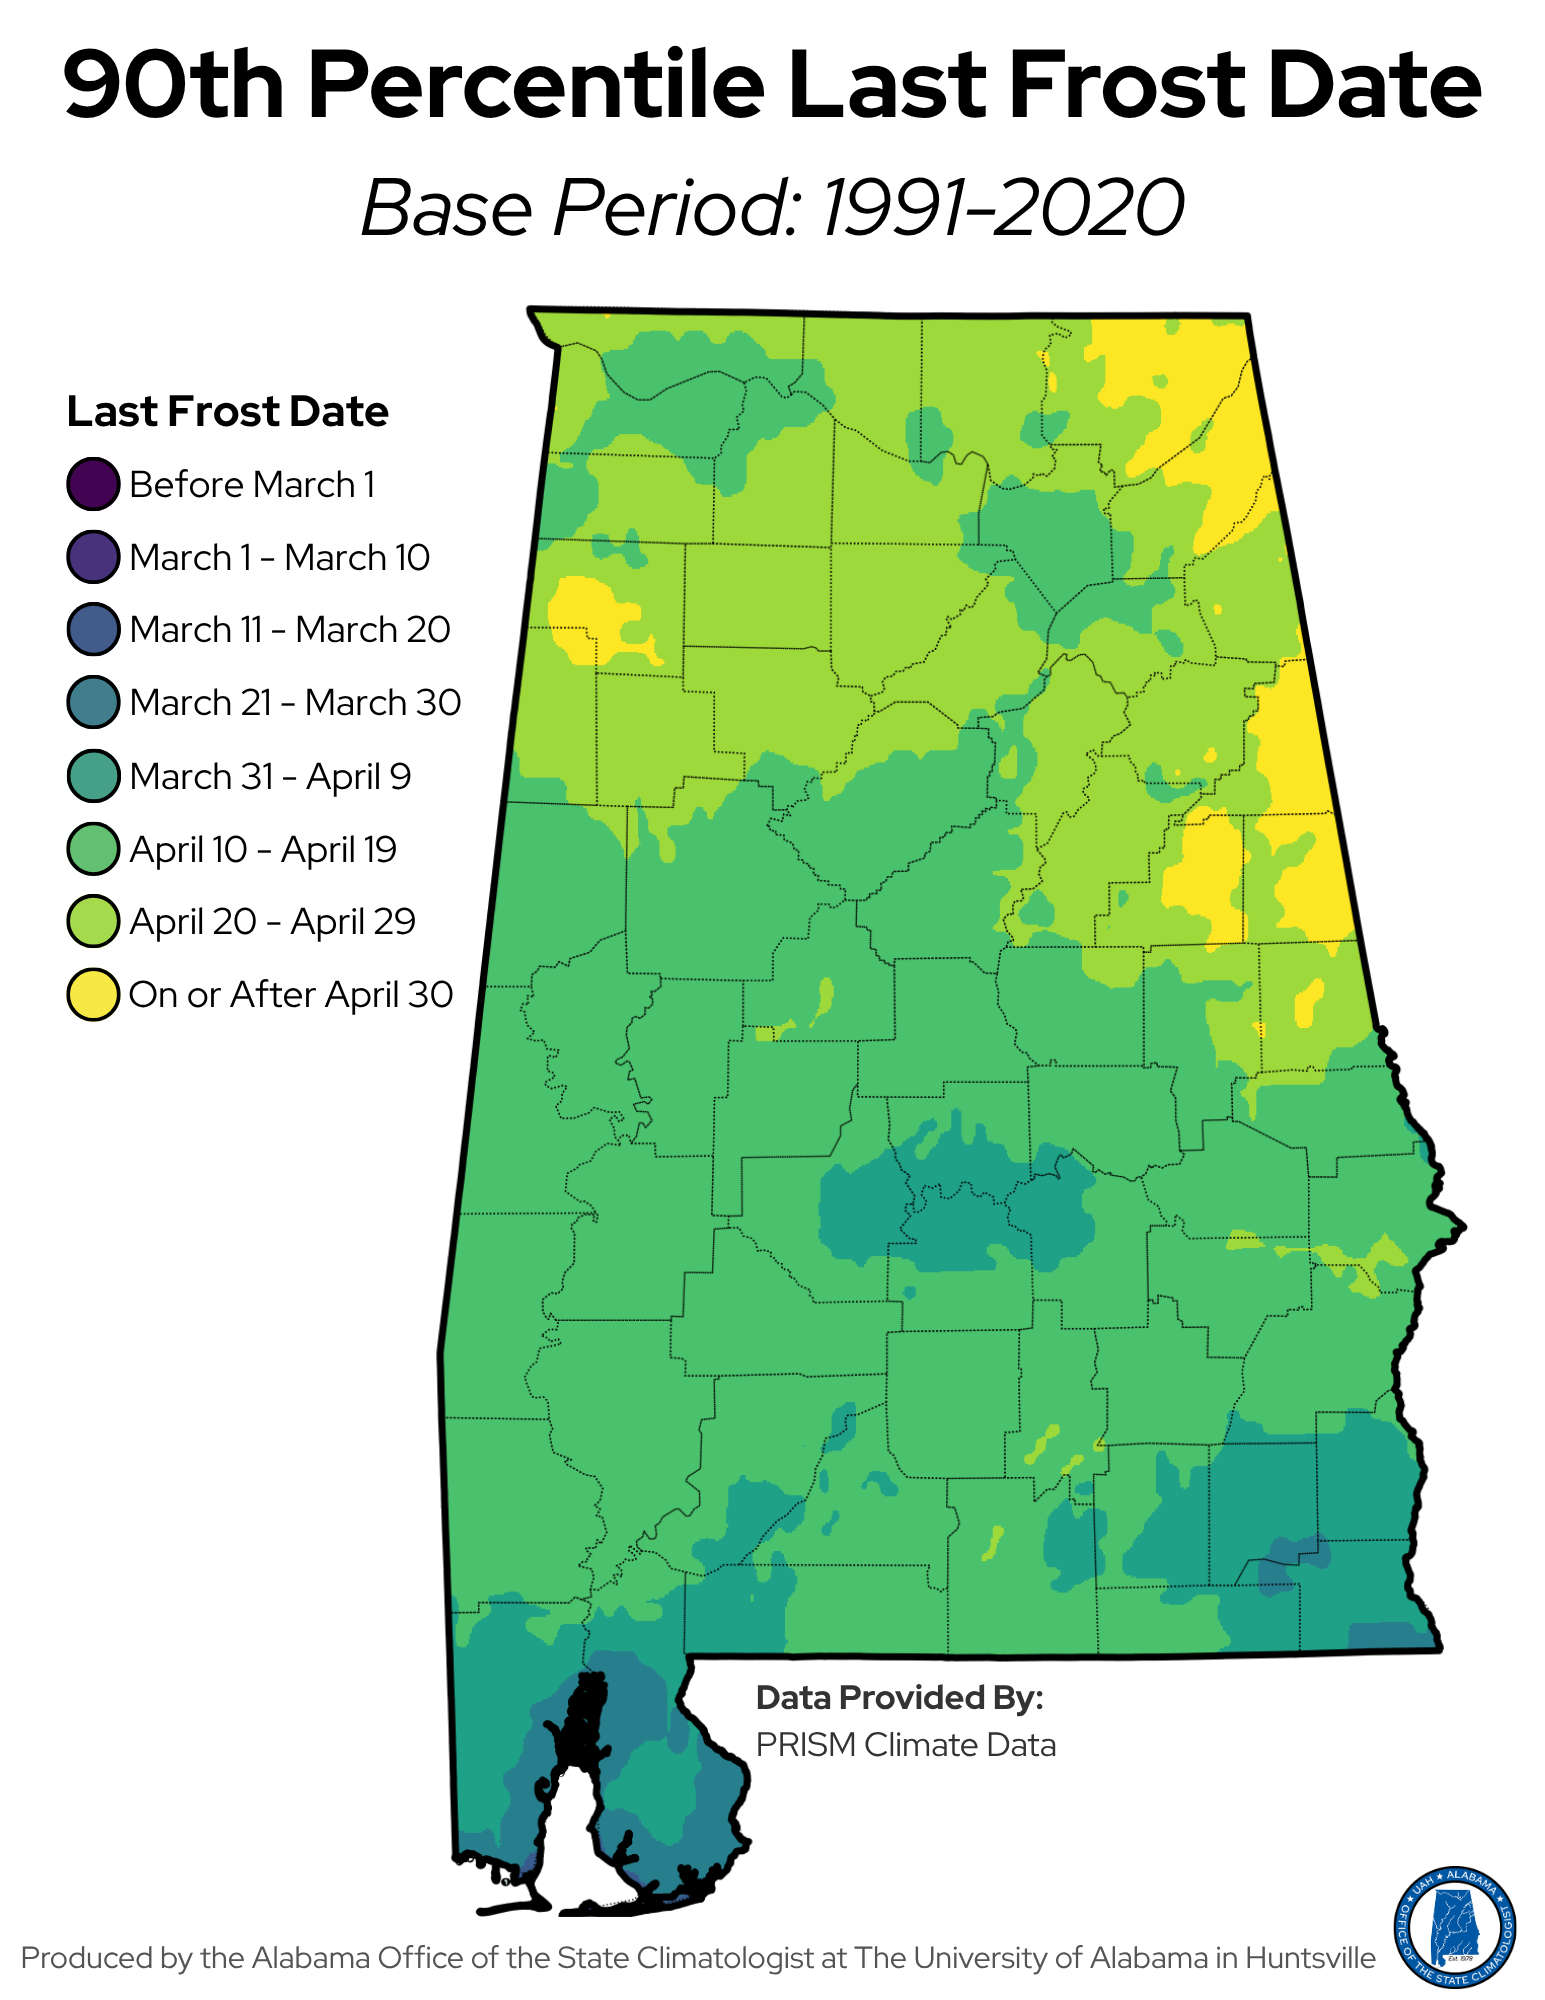
Figures 5-8 move beyond the average and help us think about that risk. The average maps represent about a 50/50 chance that a freeze or frost will not occur after that date. If planting based on an average feels too risky for you, you may instead want to utilize the 75th or 90th percentile maps.
The 75th percentile last freeze or frost date means that in 75% of years, the final freeze or frost had already occurred by that date. There is only about a 25% chance it could happen later. This provides more confidence for those who prefer to reduce risk before planting. The 90th percentile offers even greater assurance. By that date, the final freeze or frost had occurred in 90% of years, leaving just a 10% chance of a later event. This information is often used by risk-averse growers or those planting high-value or sensitive crops.
The 90th percentile maps show how much longer freeze and frost risk can linger compared to the average dates. Across much of Alabama, freezes have historically occurred into mid-March in many years, and frosts have extended into mid-April. While coastal communities still warm first, much of the state carries some level of frost risk well beyond the average date.
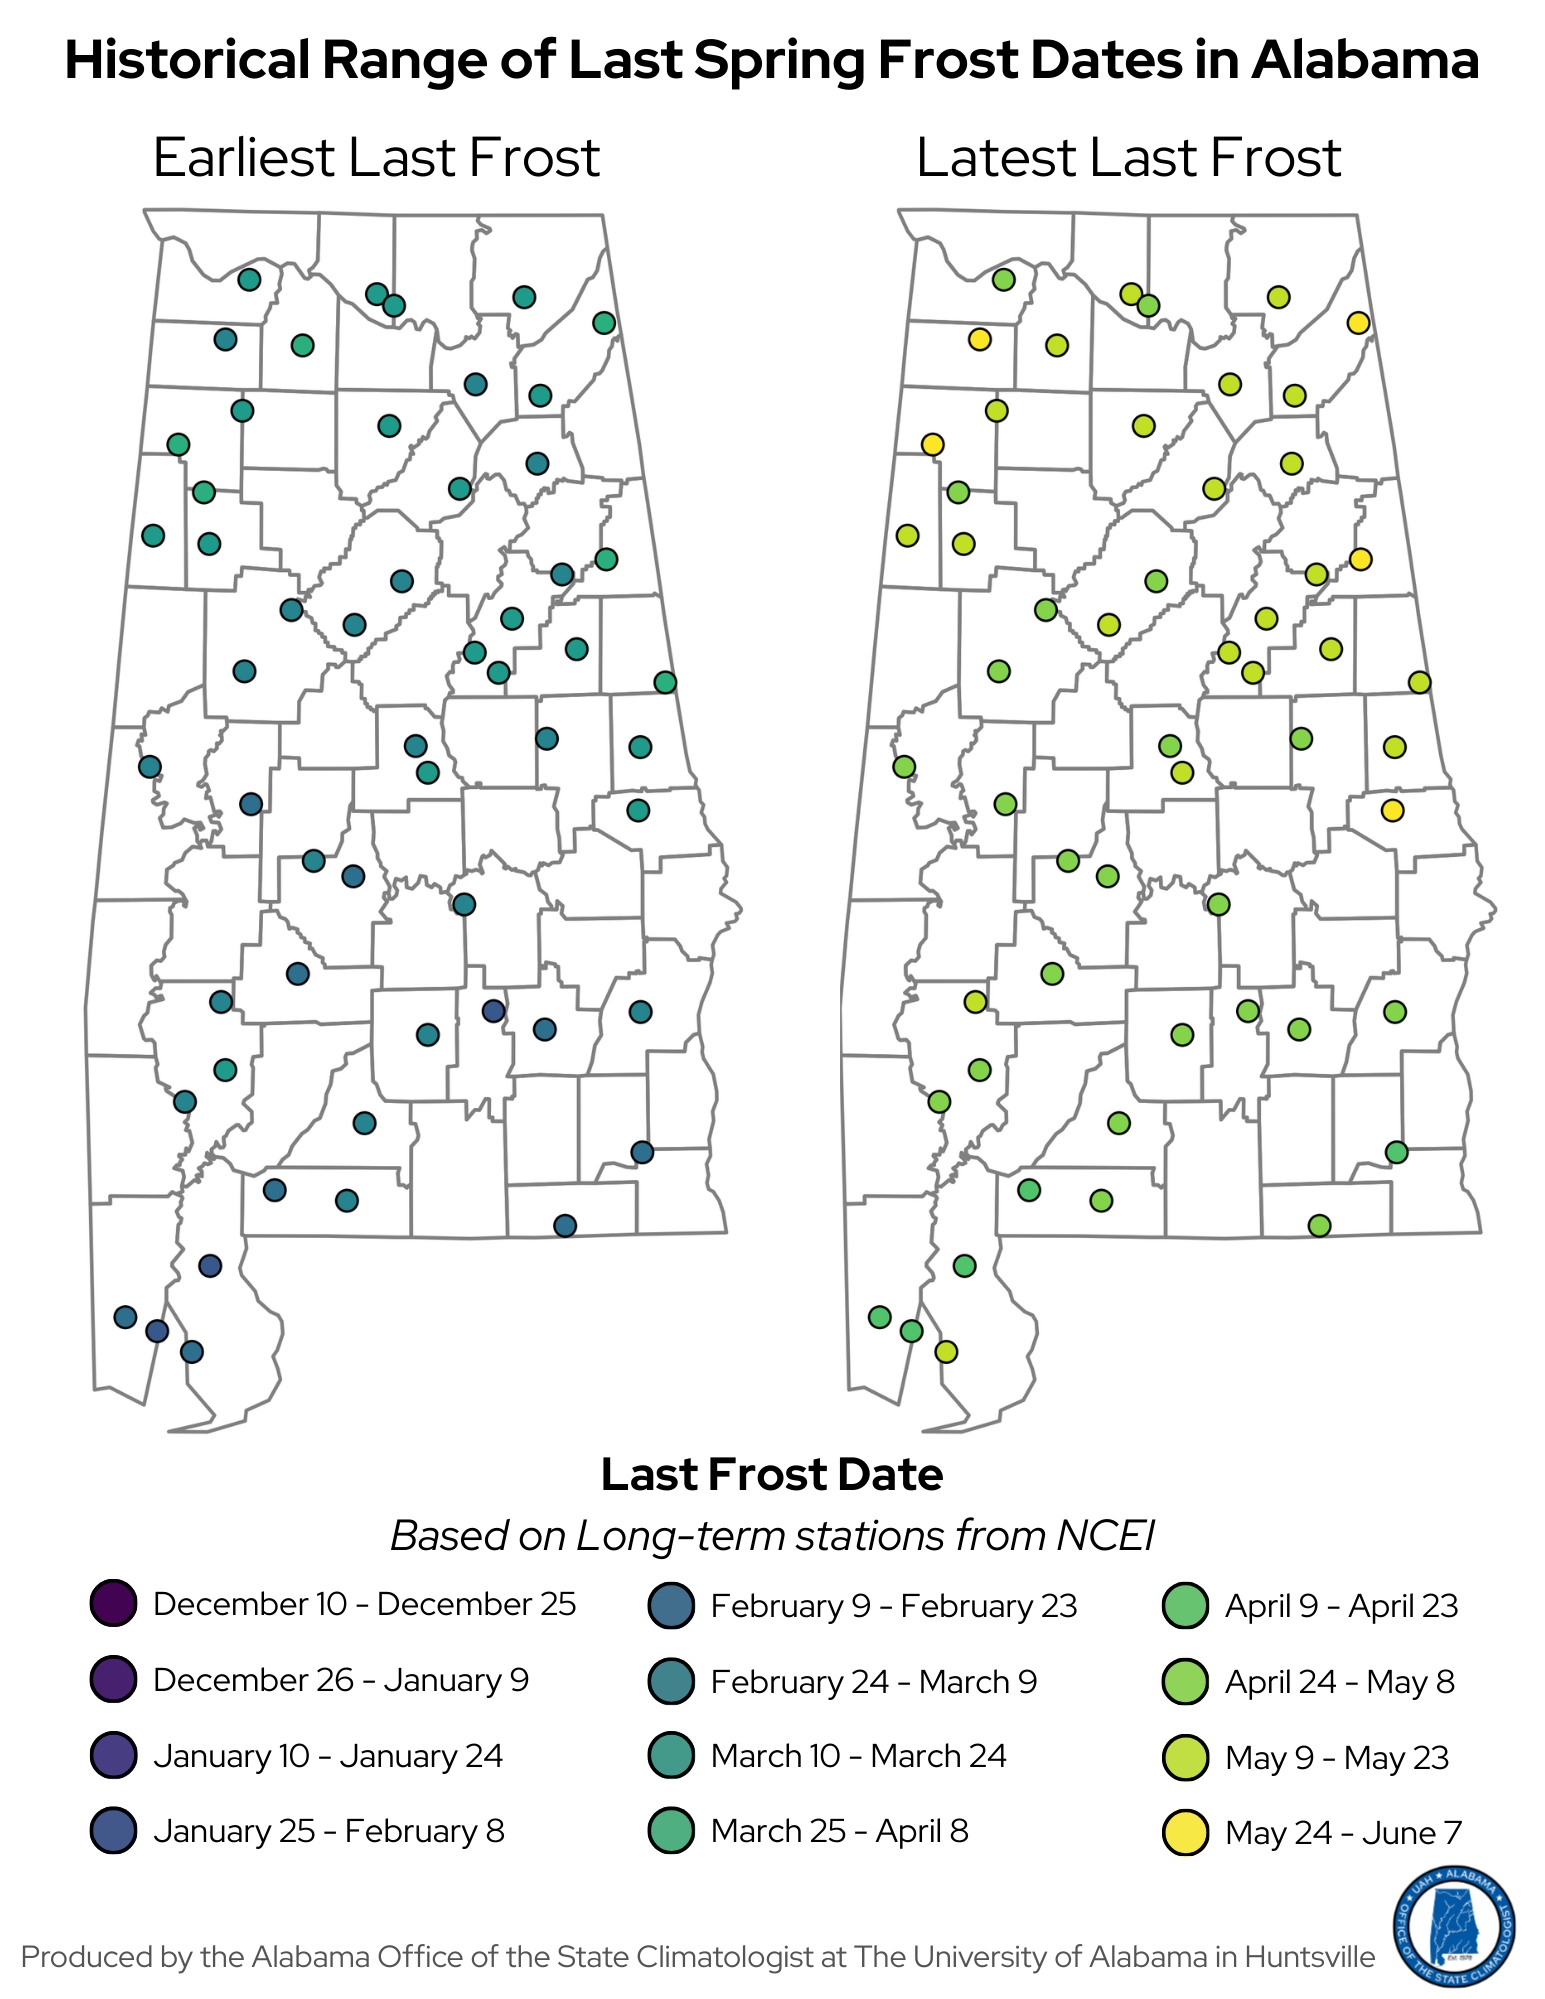
How Late Has Freeze or Frost Ever Occurred?
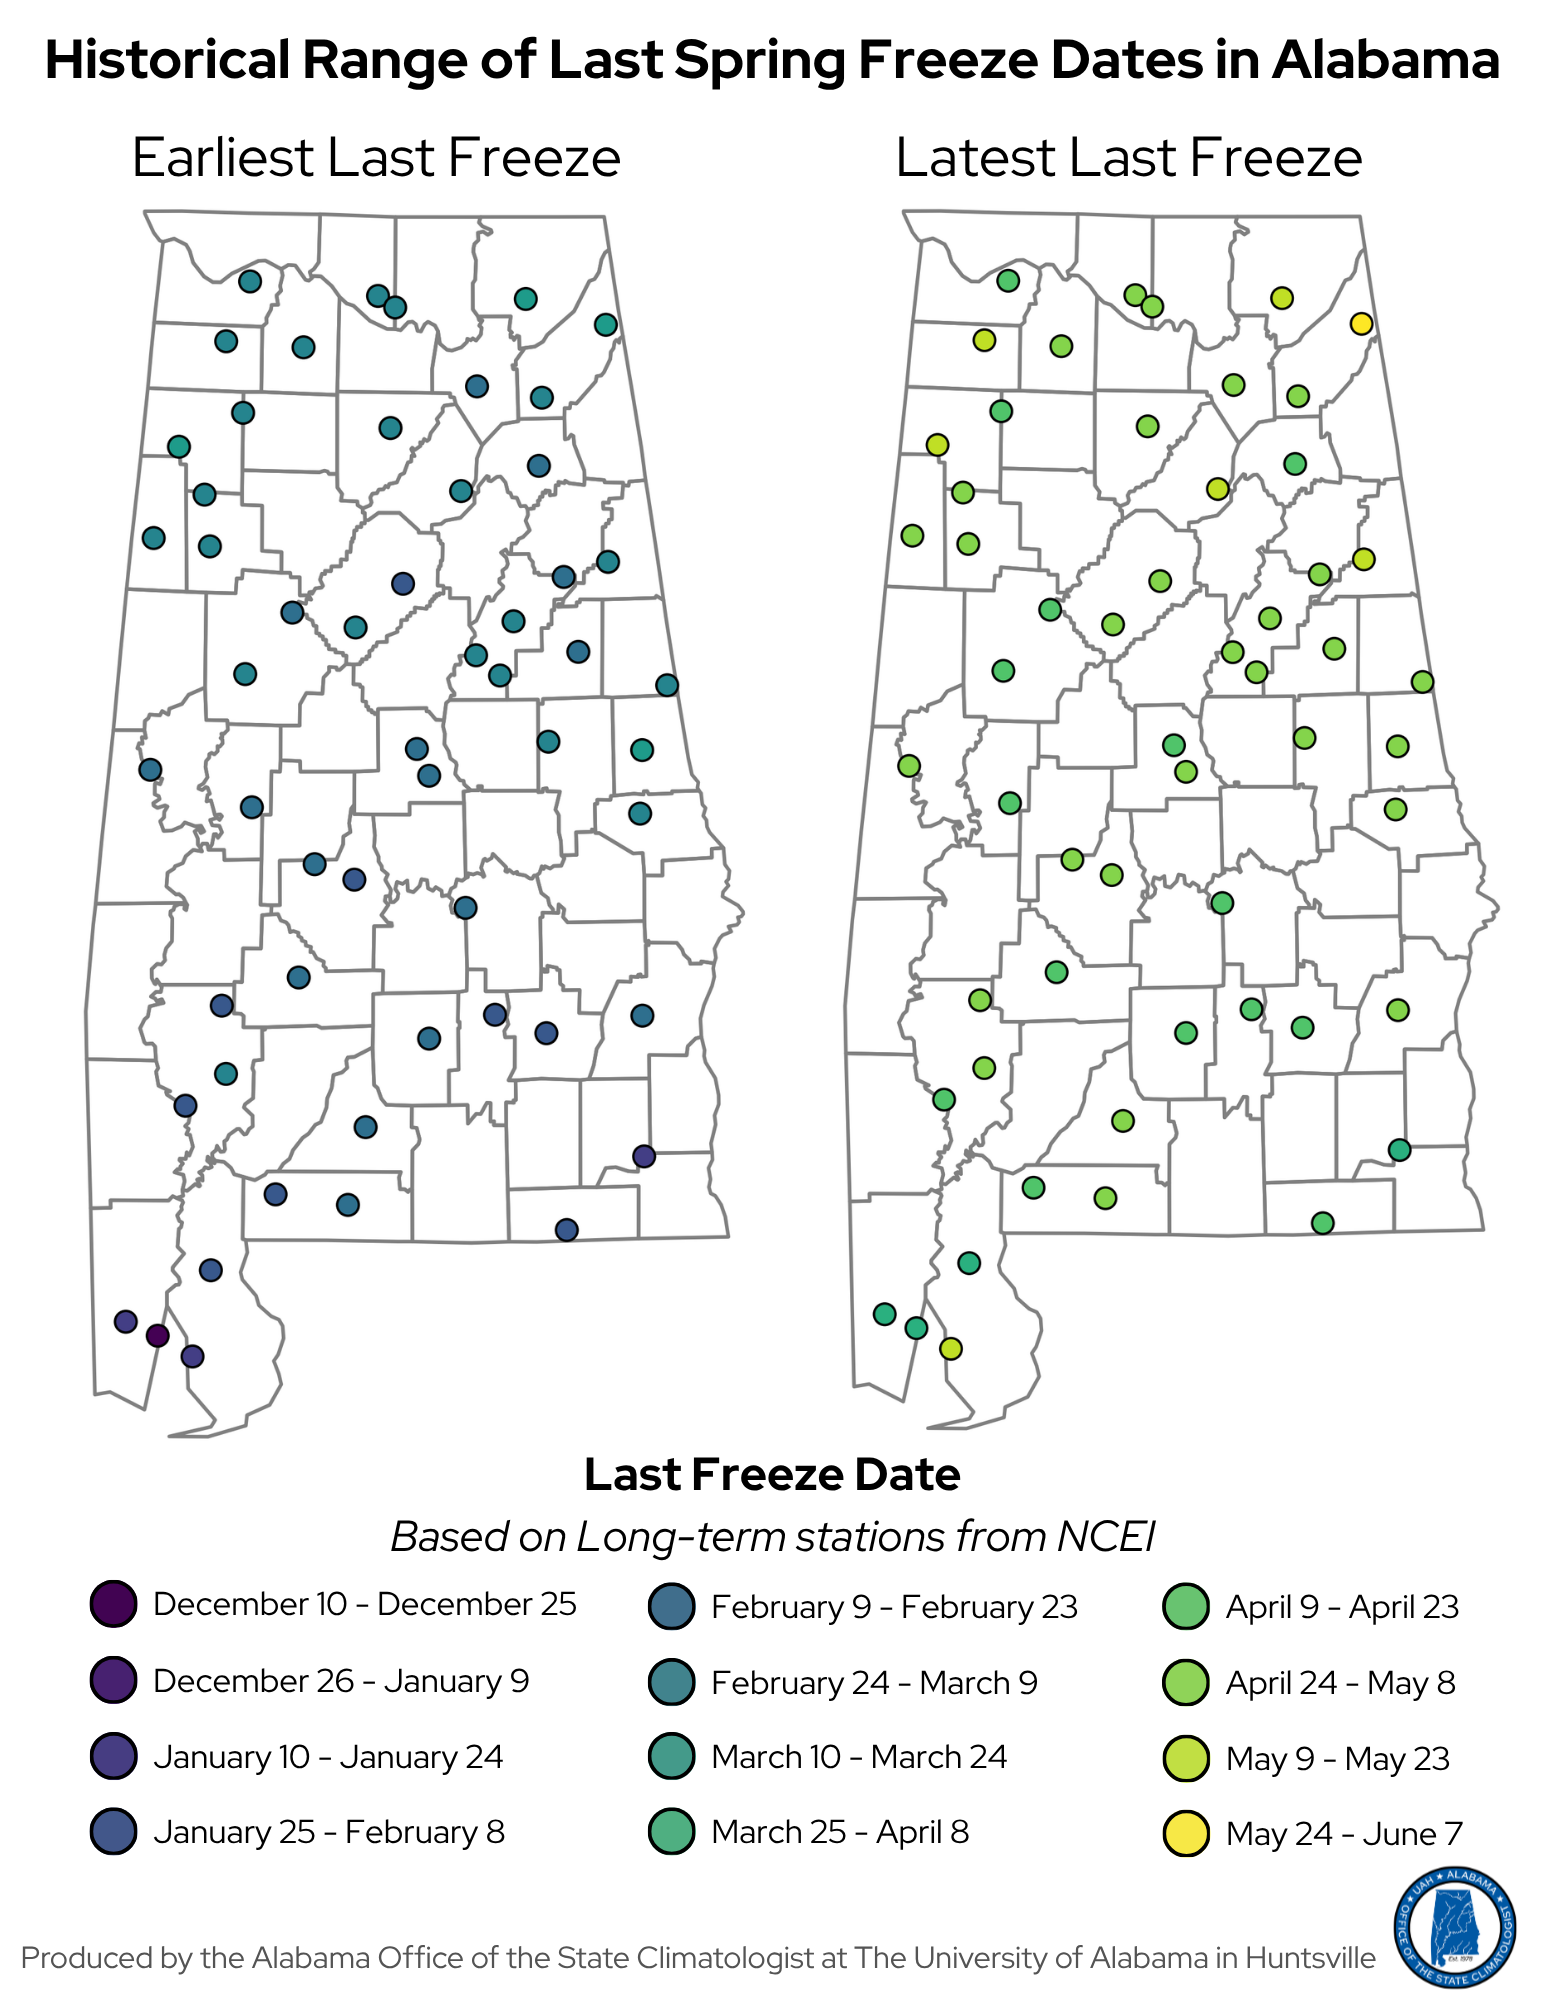
While averages and percentiles help us understand typical conditions and levels of risk, long-term station records show us the most extreme late-season events on record. The latest recorded last freeze in Alabama occurred on May 30th in Valley Head in 1984*, and the latest recorded last frost occurred on June 4th in Russellville in 1969*. According to long-term station data across the state, many locations have experienced a freeze at some point into late April and even early May. Frost dates show even more variation, with several stations recording frost into mid-May and, in one case, into early June!
It is important to remember that these extremes were recorded at individual stations and do not represent statewide conditions in those years. They do, however, highlight that late-season cold events, while uncommon, are possible, especially in northern and higher elevation areas of Alabama. You can view Figures 9 and 10 and Table 1 for last freeze and last frost dates specific to your area. If you have further questions, you can reach out to us at aosc@uah.edu.
*Note that the Valley Head and Russellville stations have not been active for the same amount of time. Valley Head has been active since 1893 and Russellville has been active since 1953.
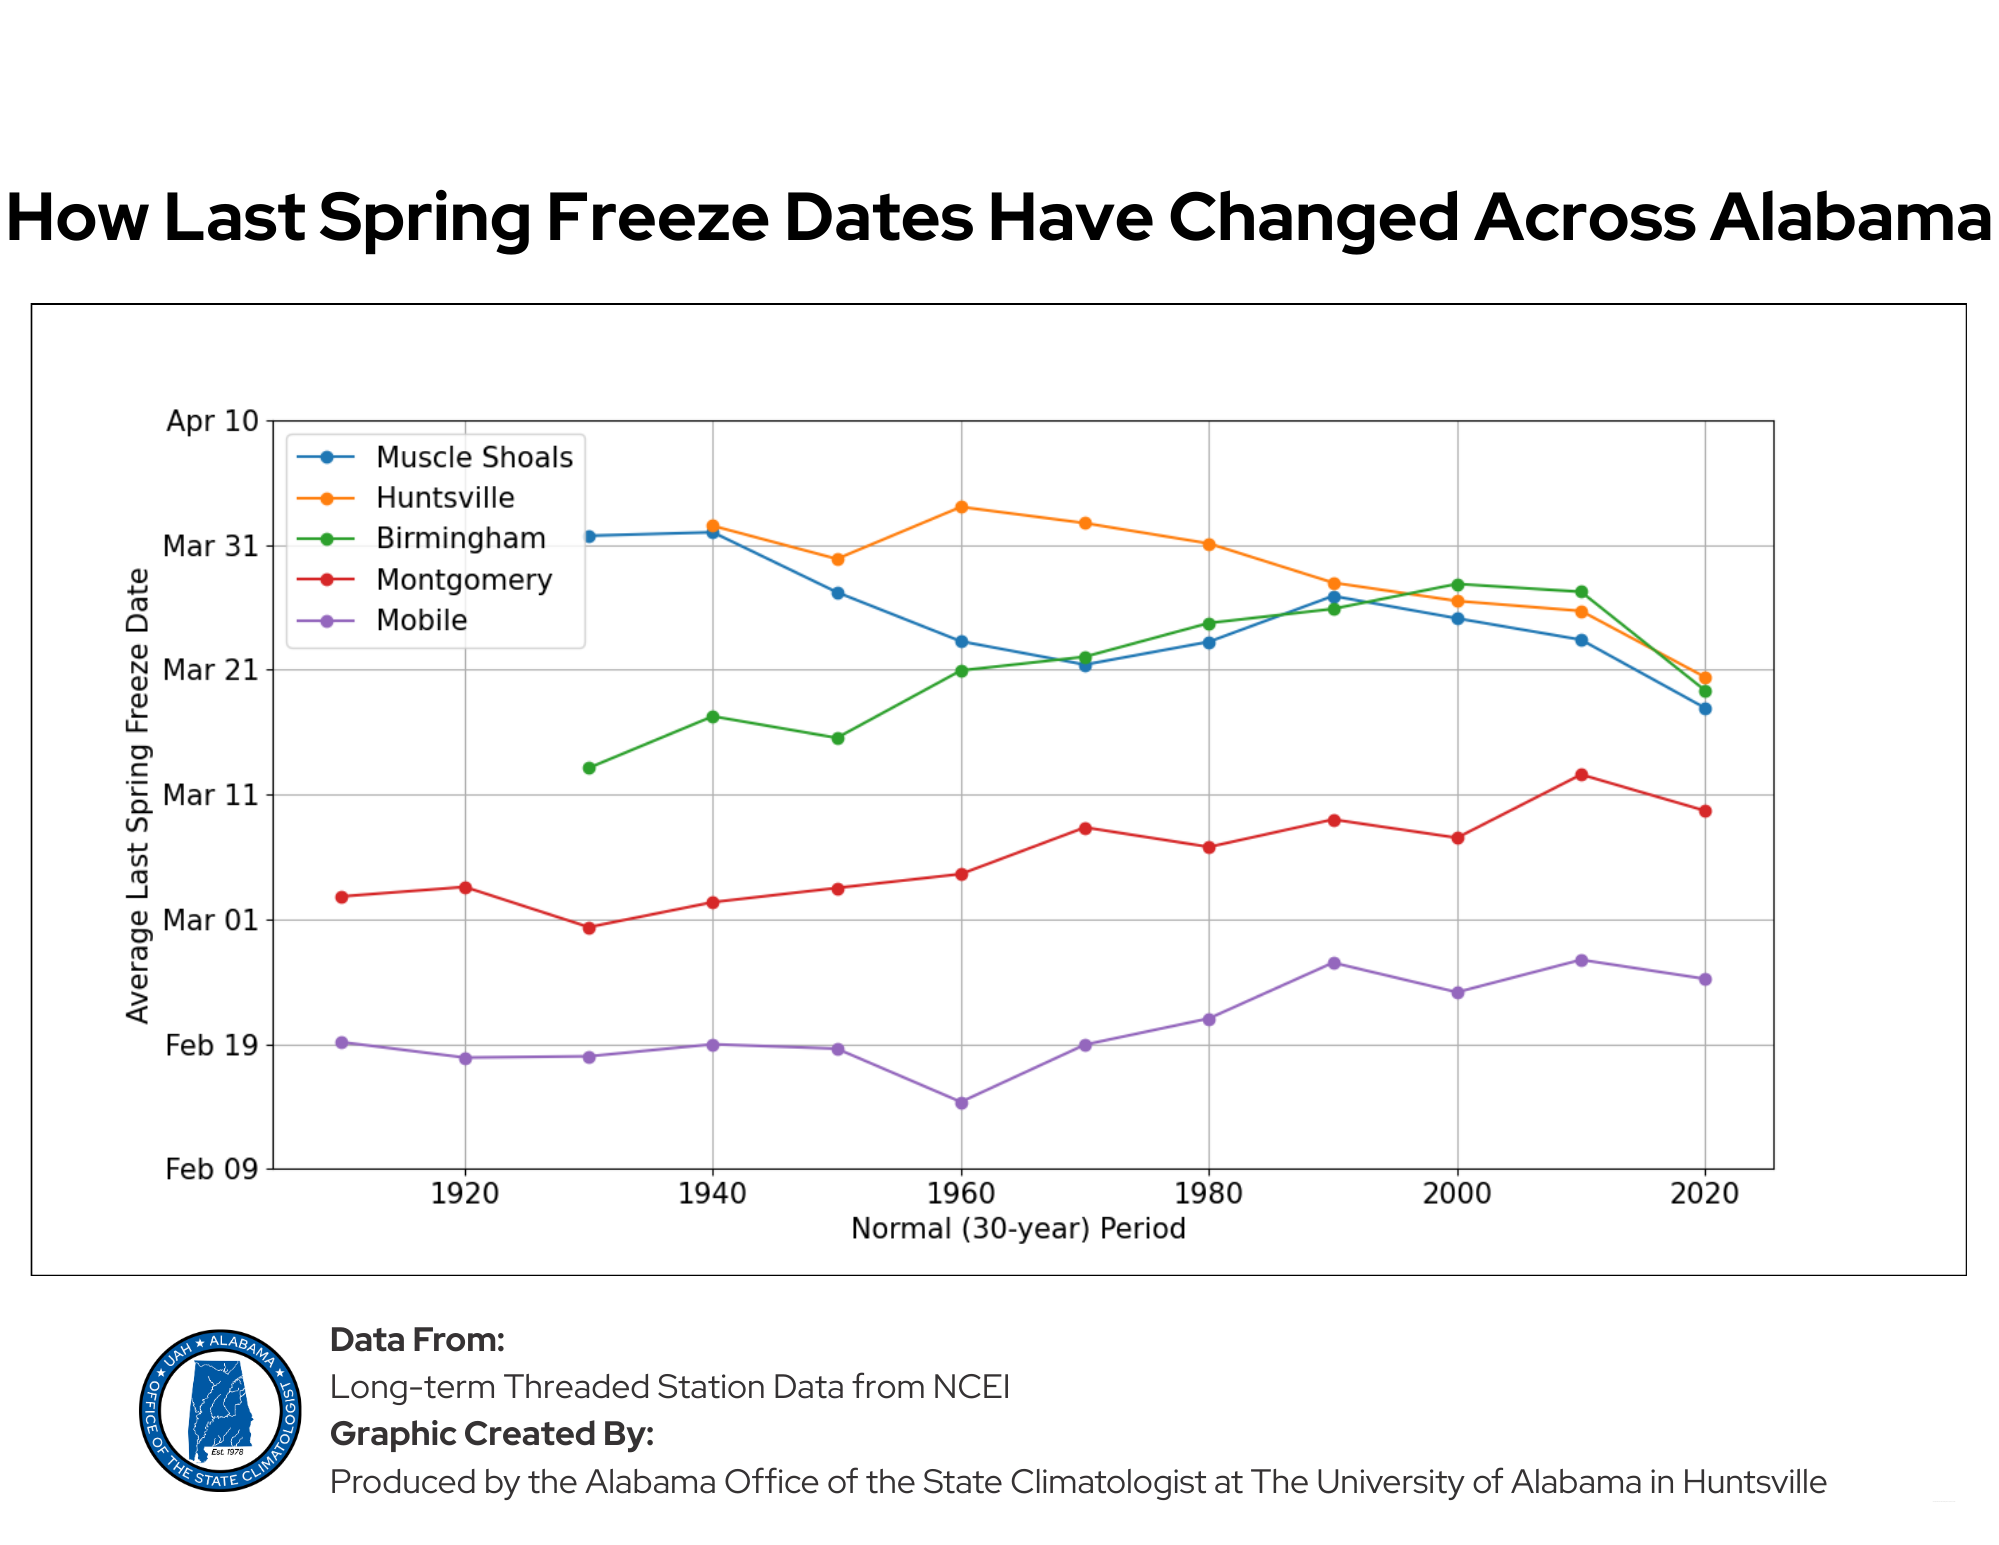
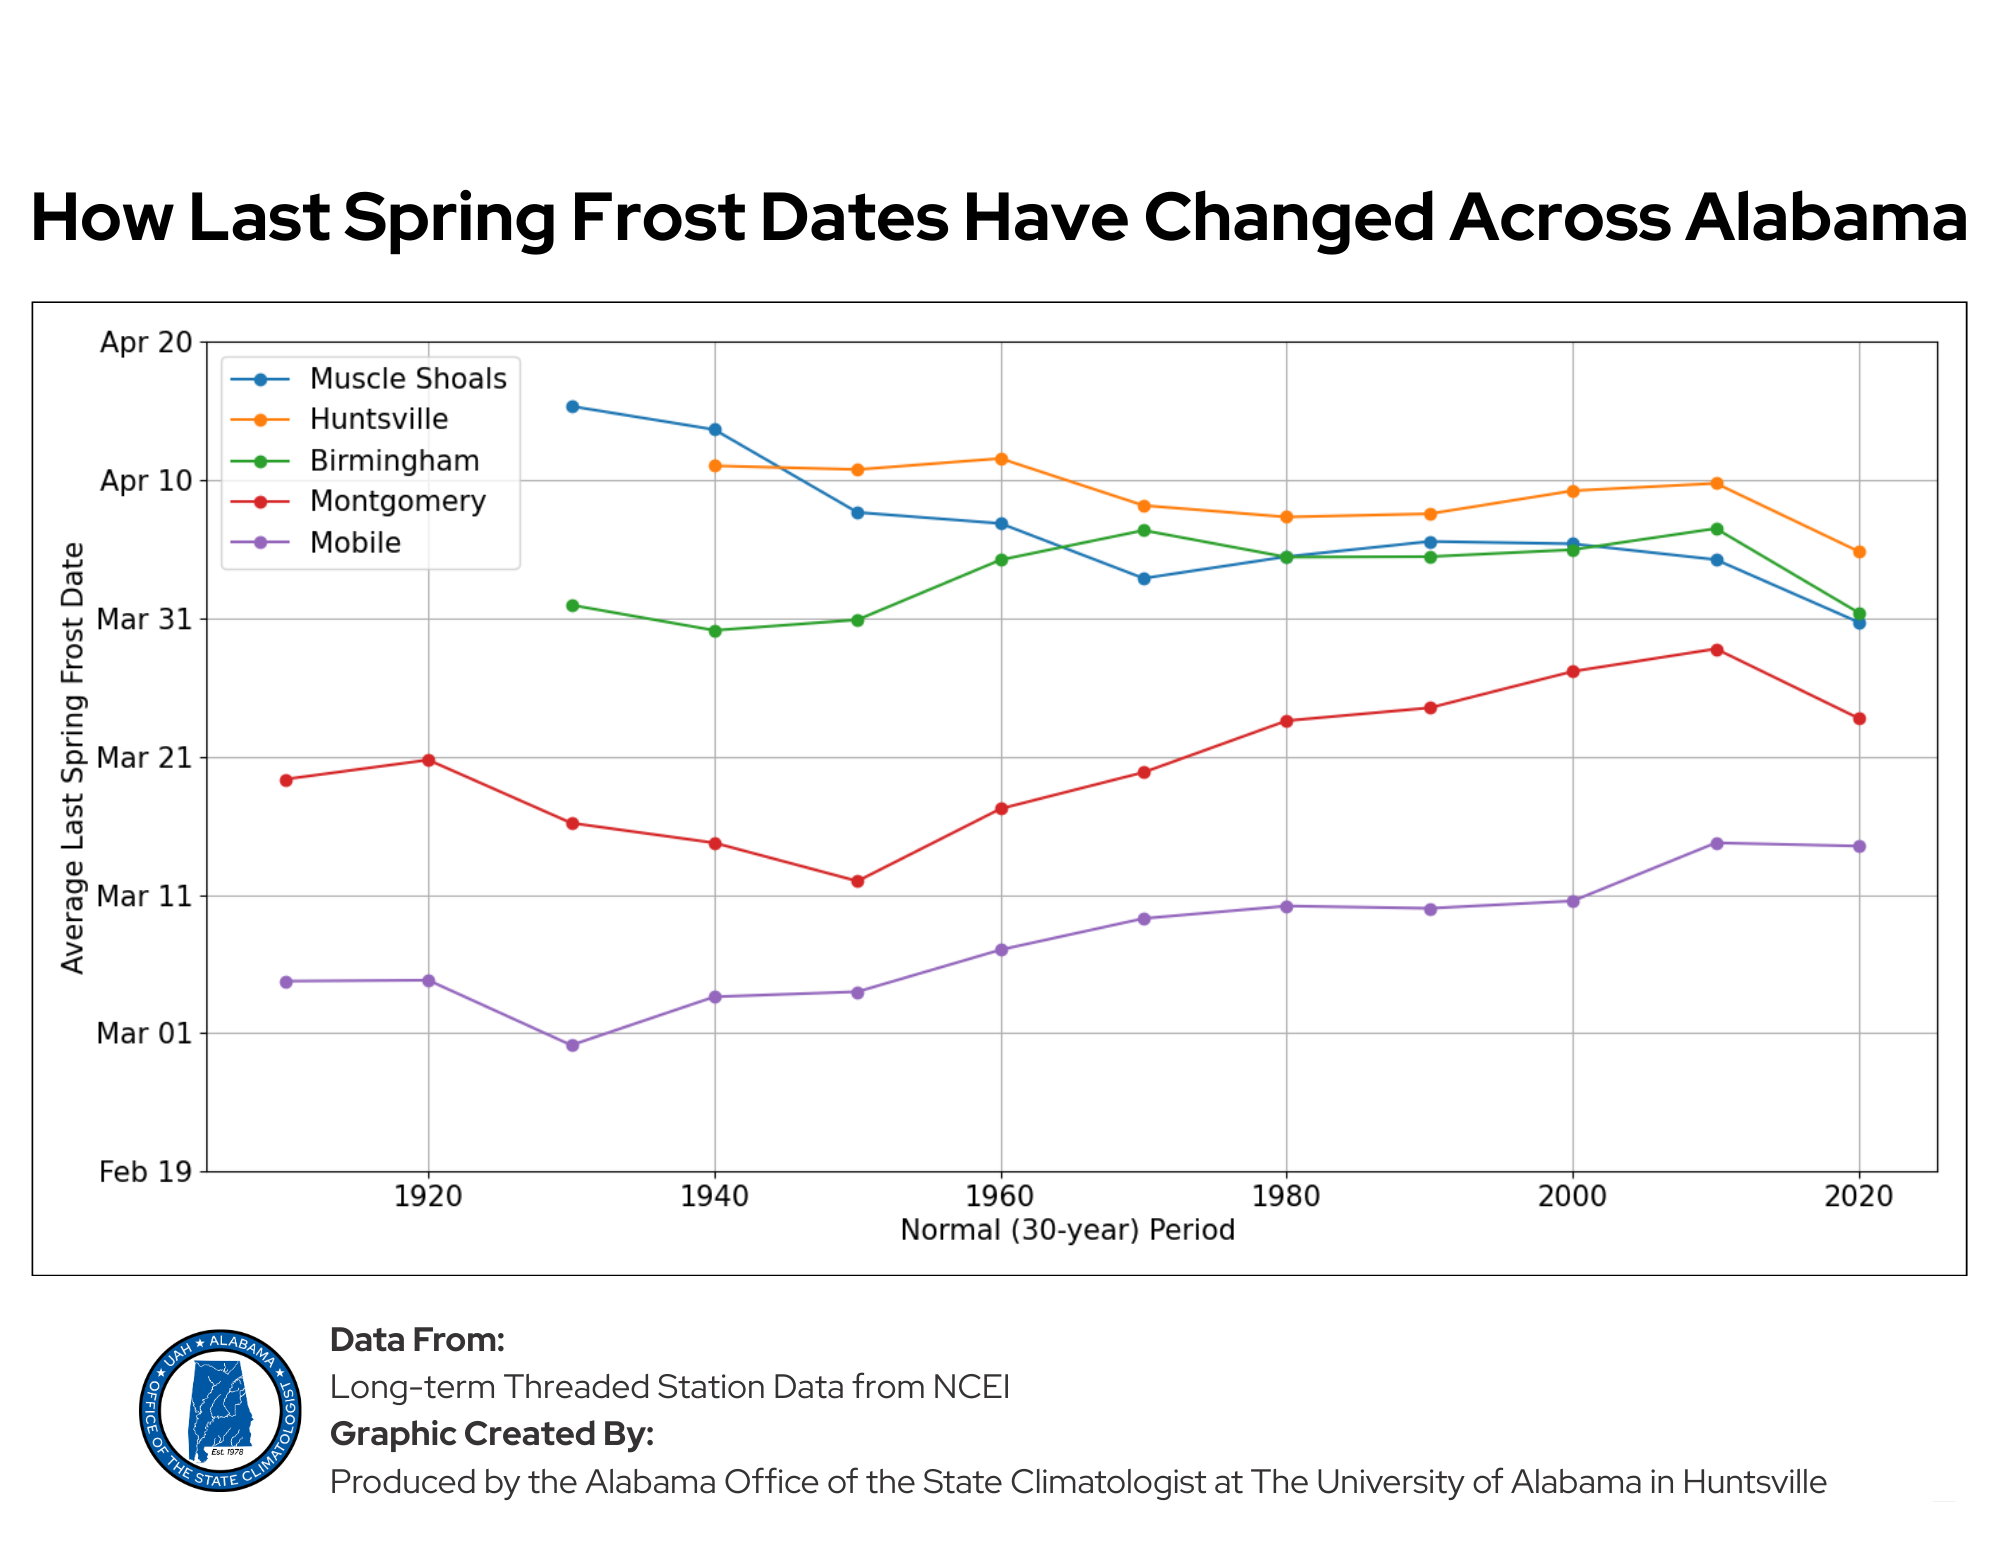
How Are These Dates Changing?
To see whether last freeze and last frost dates are shifting over time, we also compared long-term records for five representative cities: Huntsville and Muscle Shoals in North Alabama, Birmingham and Montgomery in Central Alabama, and Mobile in South Alabama. Figures 11 and 12 show the average frost and freeze dates for consecutive Climate Normals (30-year periods) from 1893 (1897 for Birmingham, 1908 for Huntsville) until 2020*.
Interestingly, the patterns are not the same everywhere. North Alabama has seen a gradual shift to earlier frost/freeze dates over the past century which aligns with general trends in minimum temperatures across the state. Huntsville and Muscle Shoals saw their average freeze dates about 2 weeks earlier than in the period of 1901-1930. In Central and South Alabama, however, the average last freeze and frost dates have shown the opposite tendency in recent decades, with freezes ending slightly later on average.
Though their overall trends are not consistent, in the most recent 30-year Normals (1991-2020) , all five cities have seen those average last frost and freeze dates shift slightly earlier.
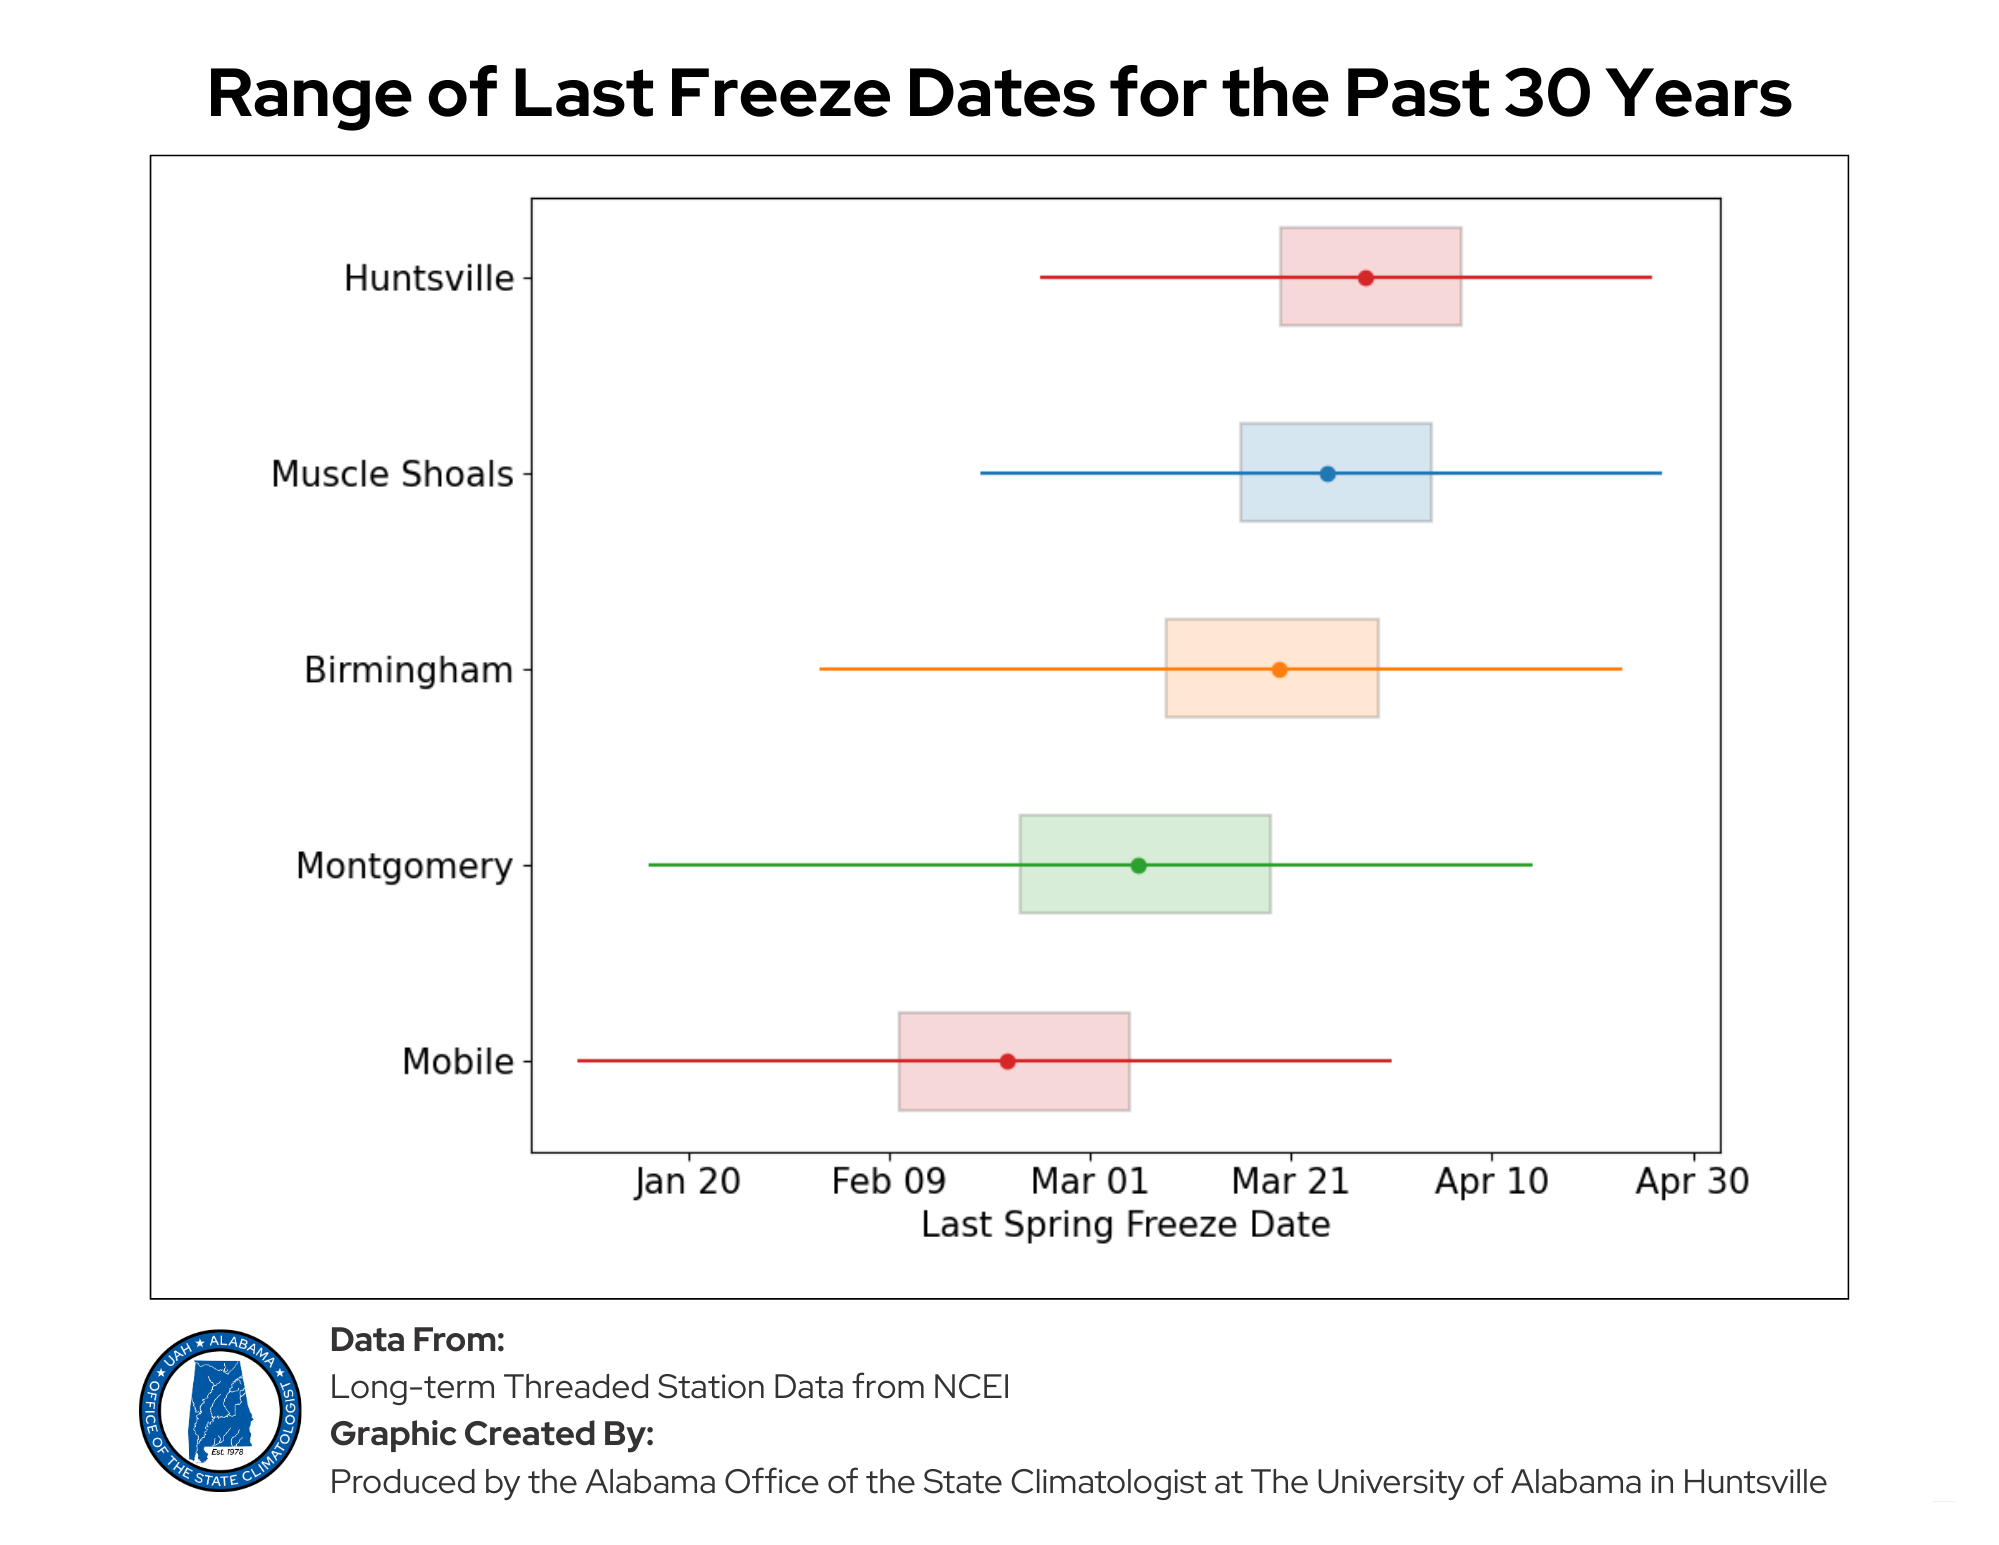
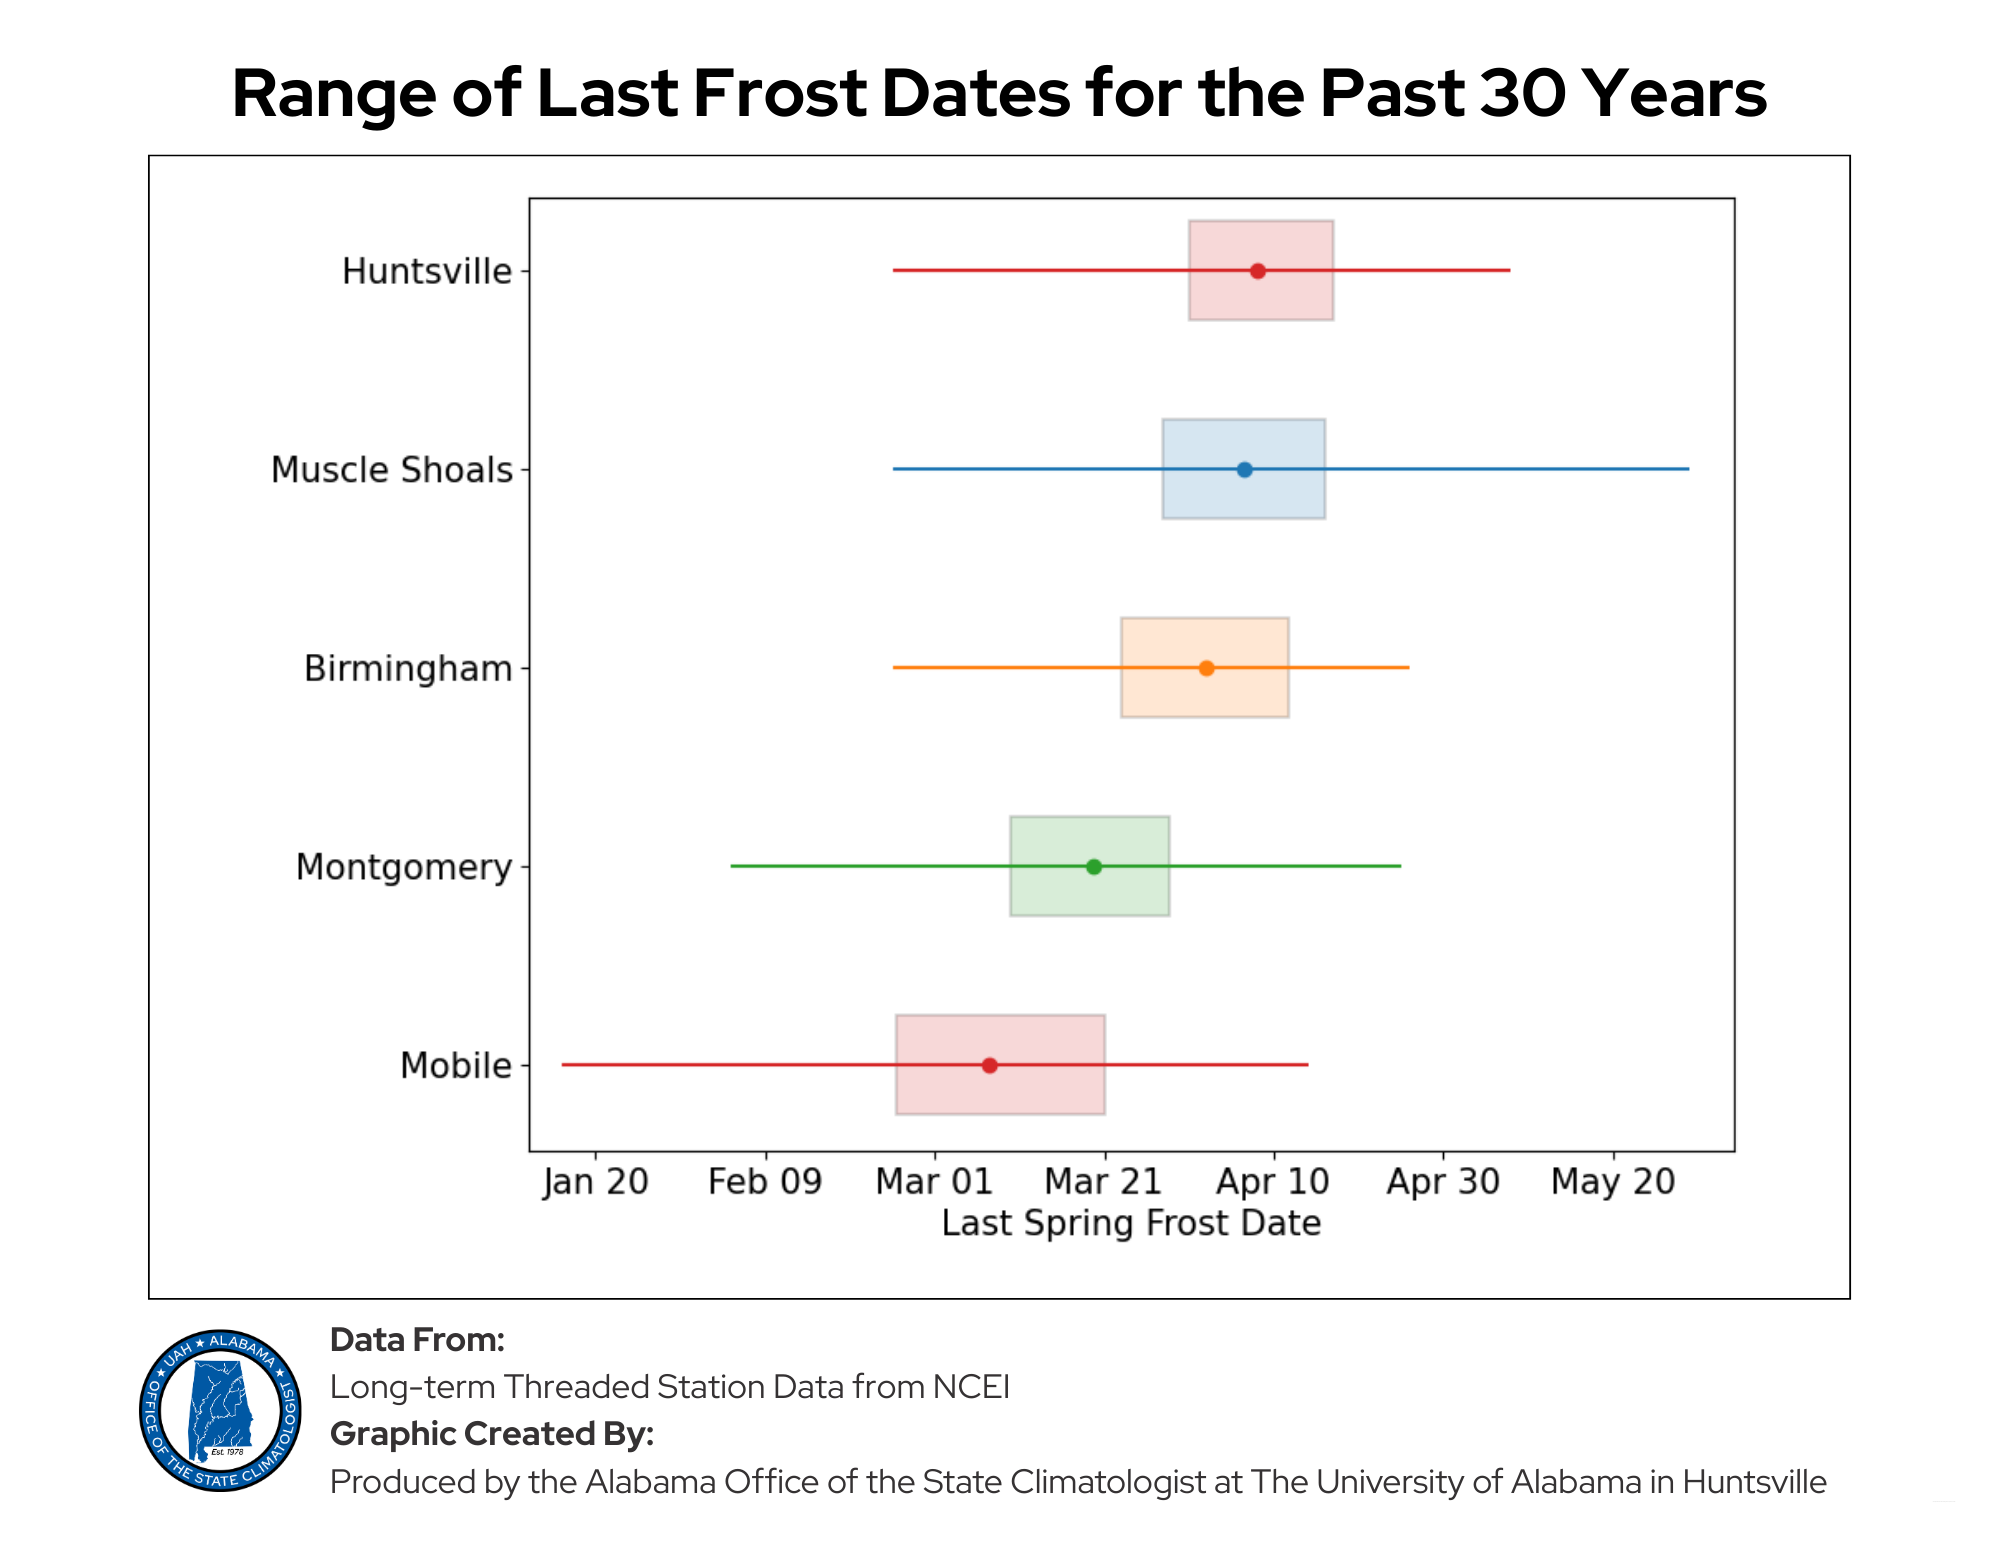
Even with these shifts, one thing remains clear: variability is significant. In every city, last freeze and frost dates continue to fluctuate from year to year. Figures 13 and 14 show that the range of last freeze and frost dates can span 2 months or more! Some springs end early. Others hold onto the cold longer than expected. A trend toward earlier or later averages does not eliminate the possibility of a late-season freeze or frost in any given year.
*This information is from threaded weather stations. A “threaded station” is a continuous long-term climate record created by linking (“threading”) data from multiple station locations within the same city or region when instruments have been relocated over time. This process reconciles overlapping and successive records to produce a single, consistent time series suitable for calculating official daily temperature and precipitation extremes.
Does the ENSO Cycle Play a Role Here?
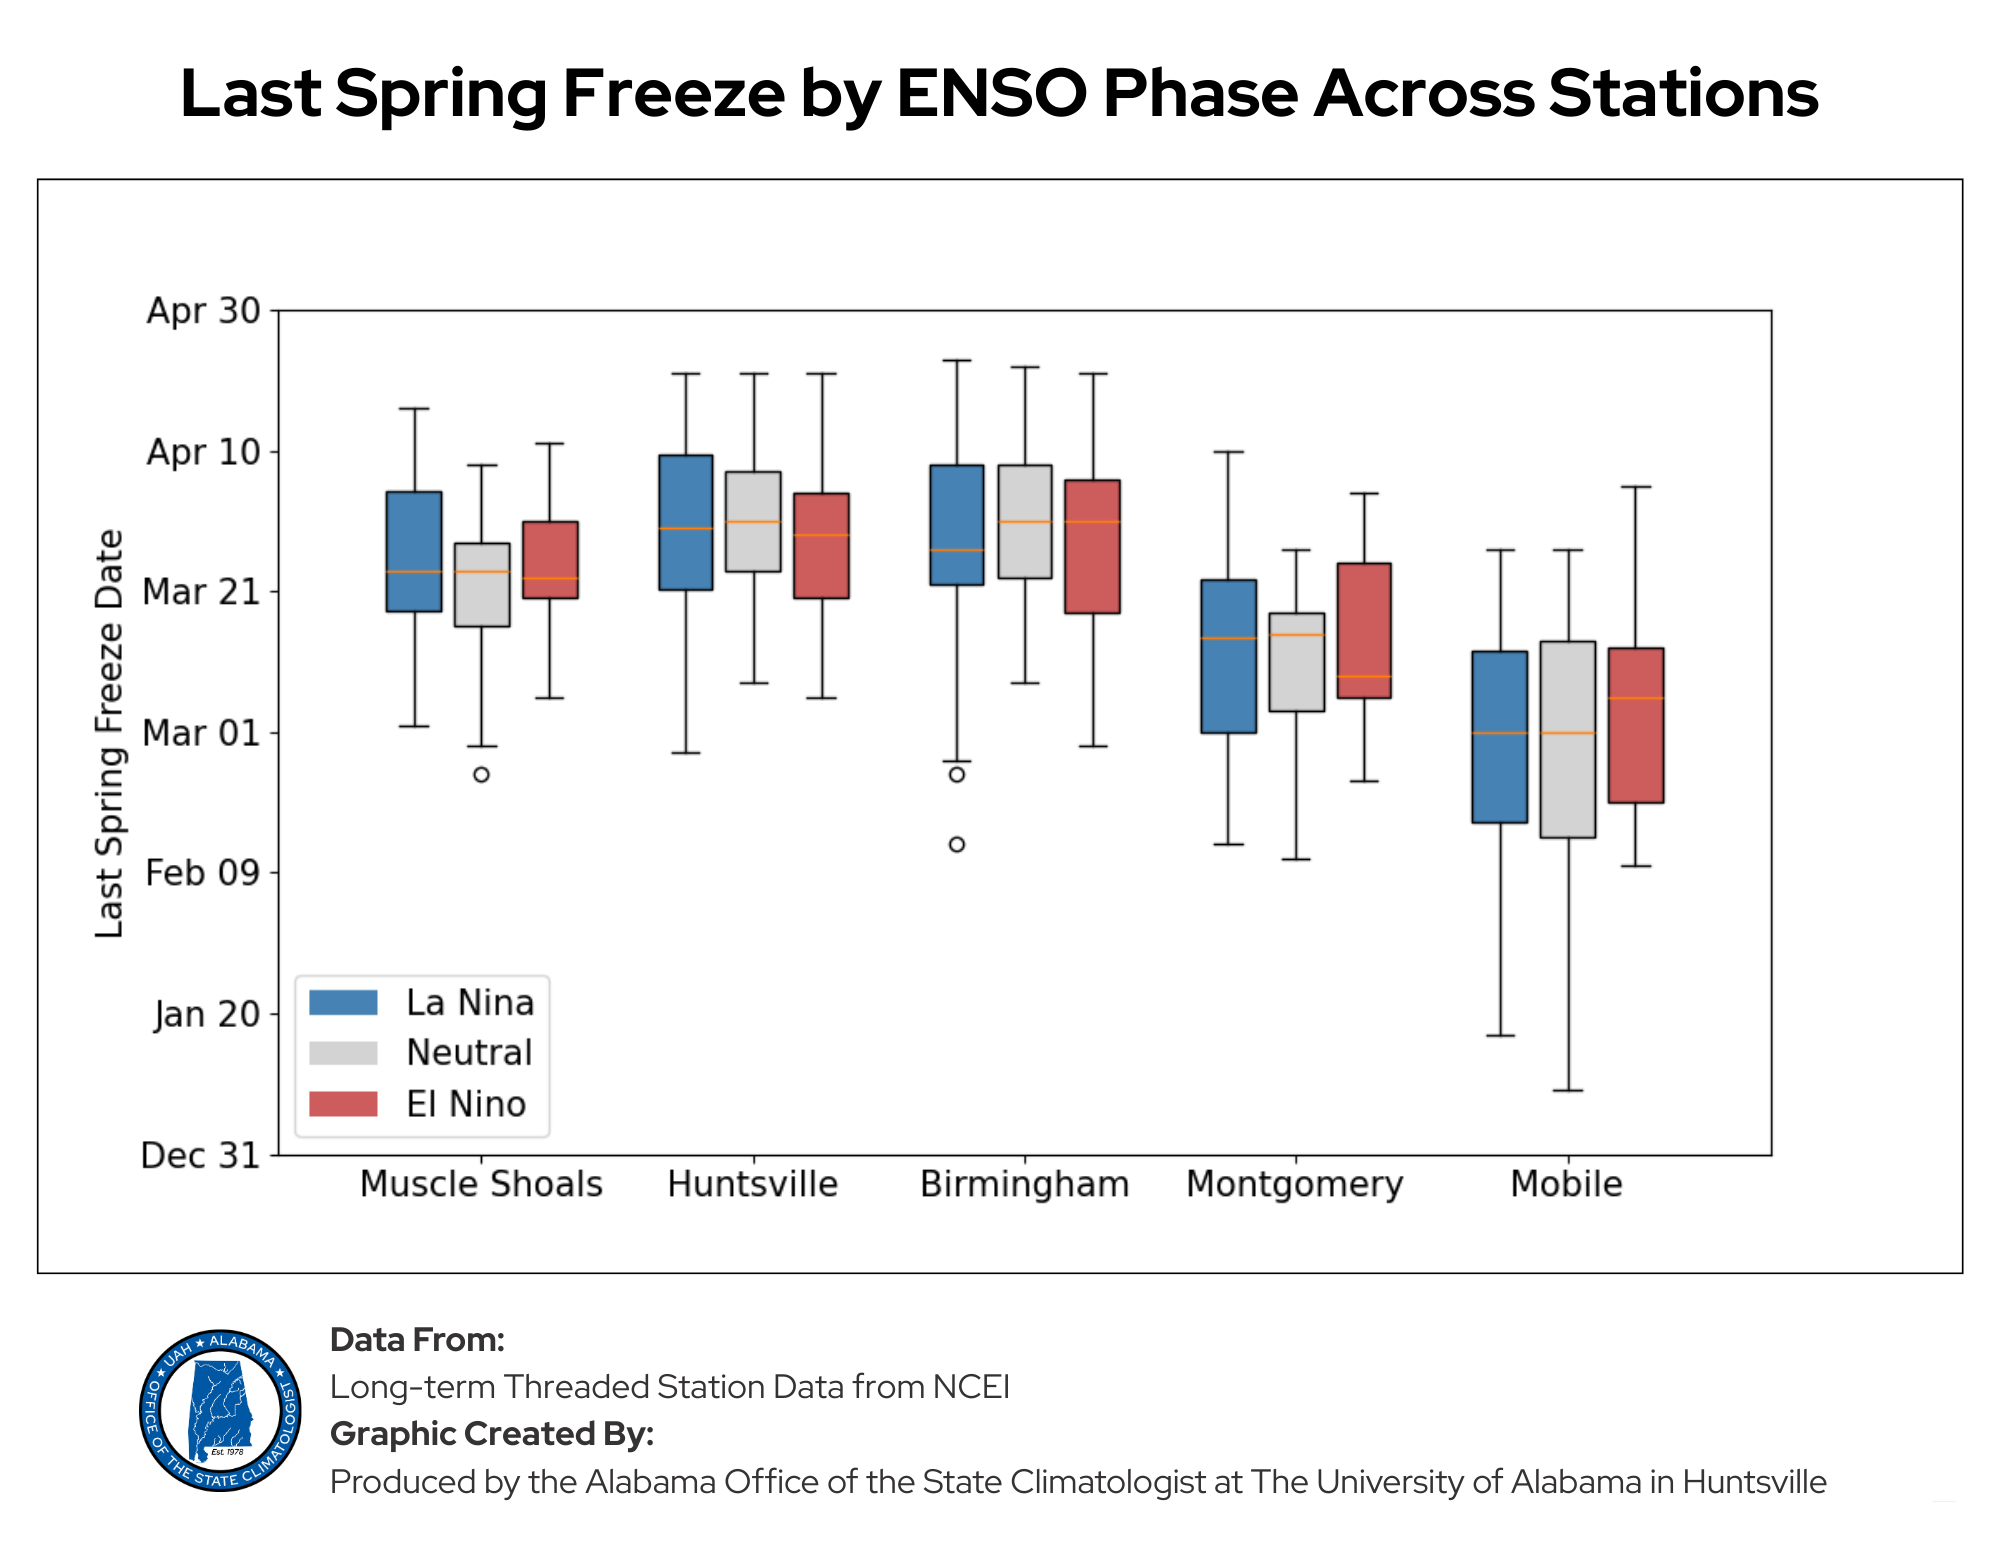
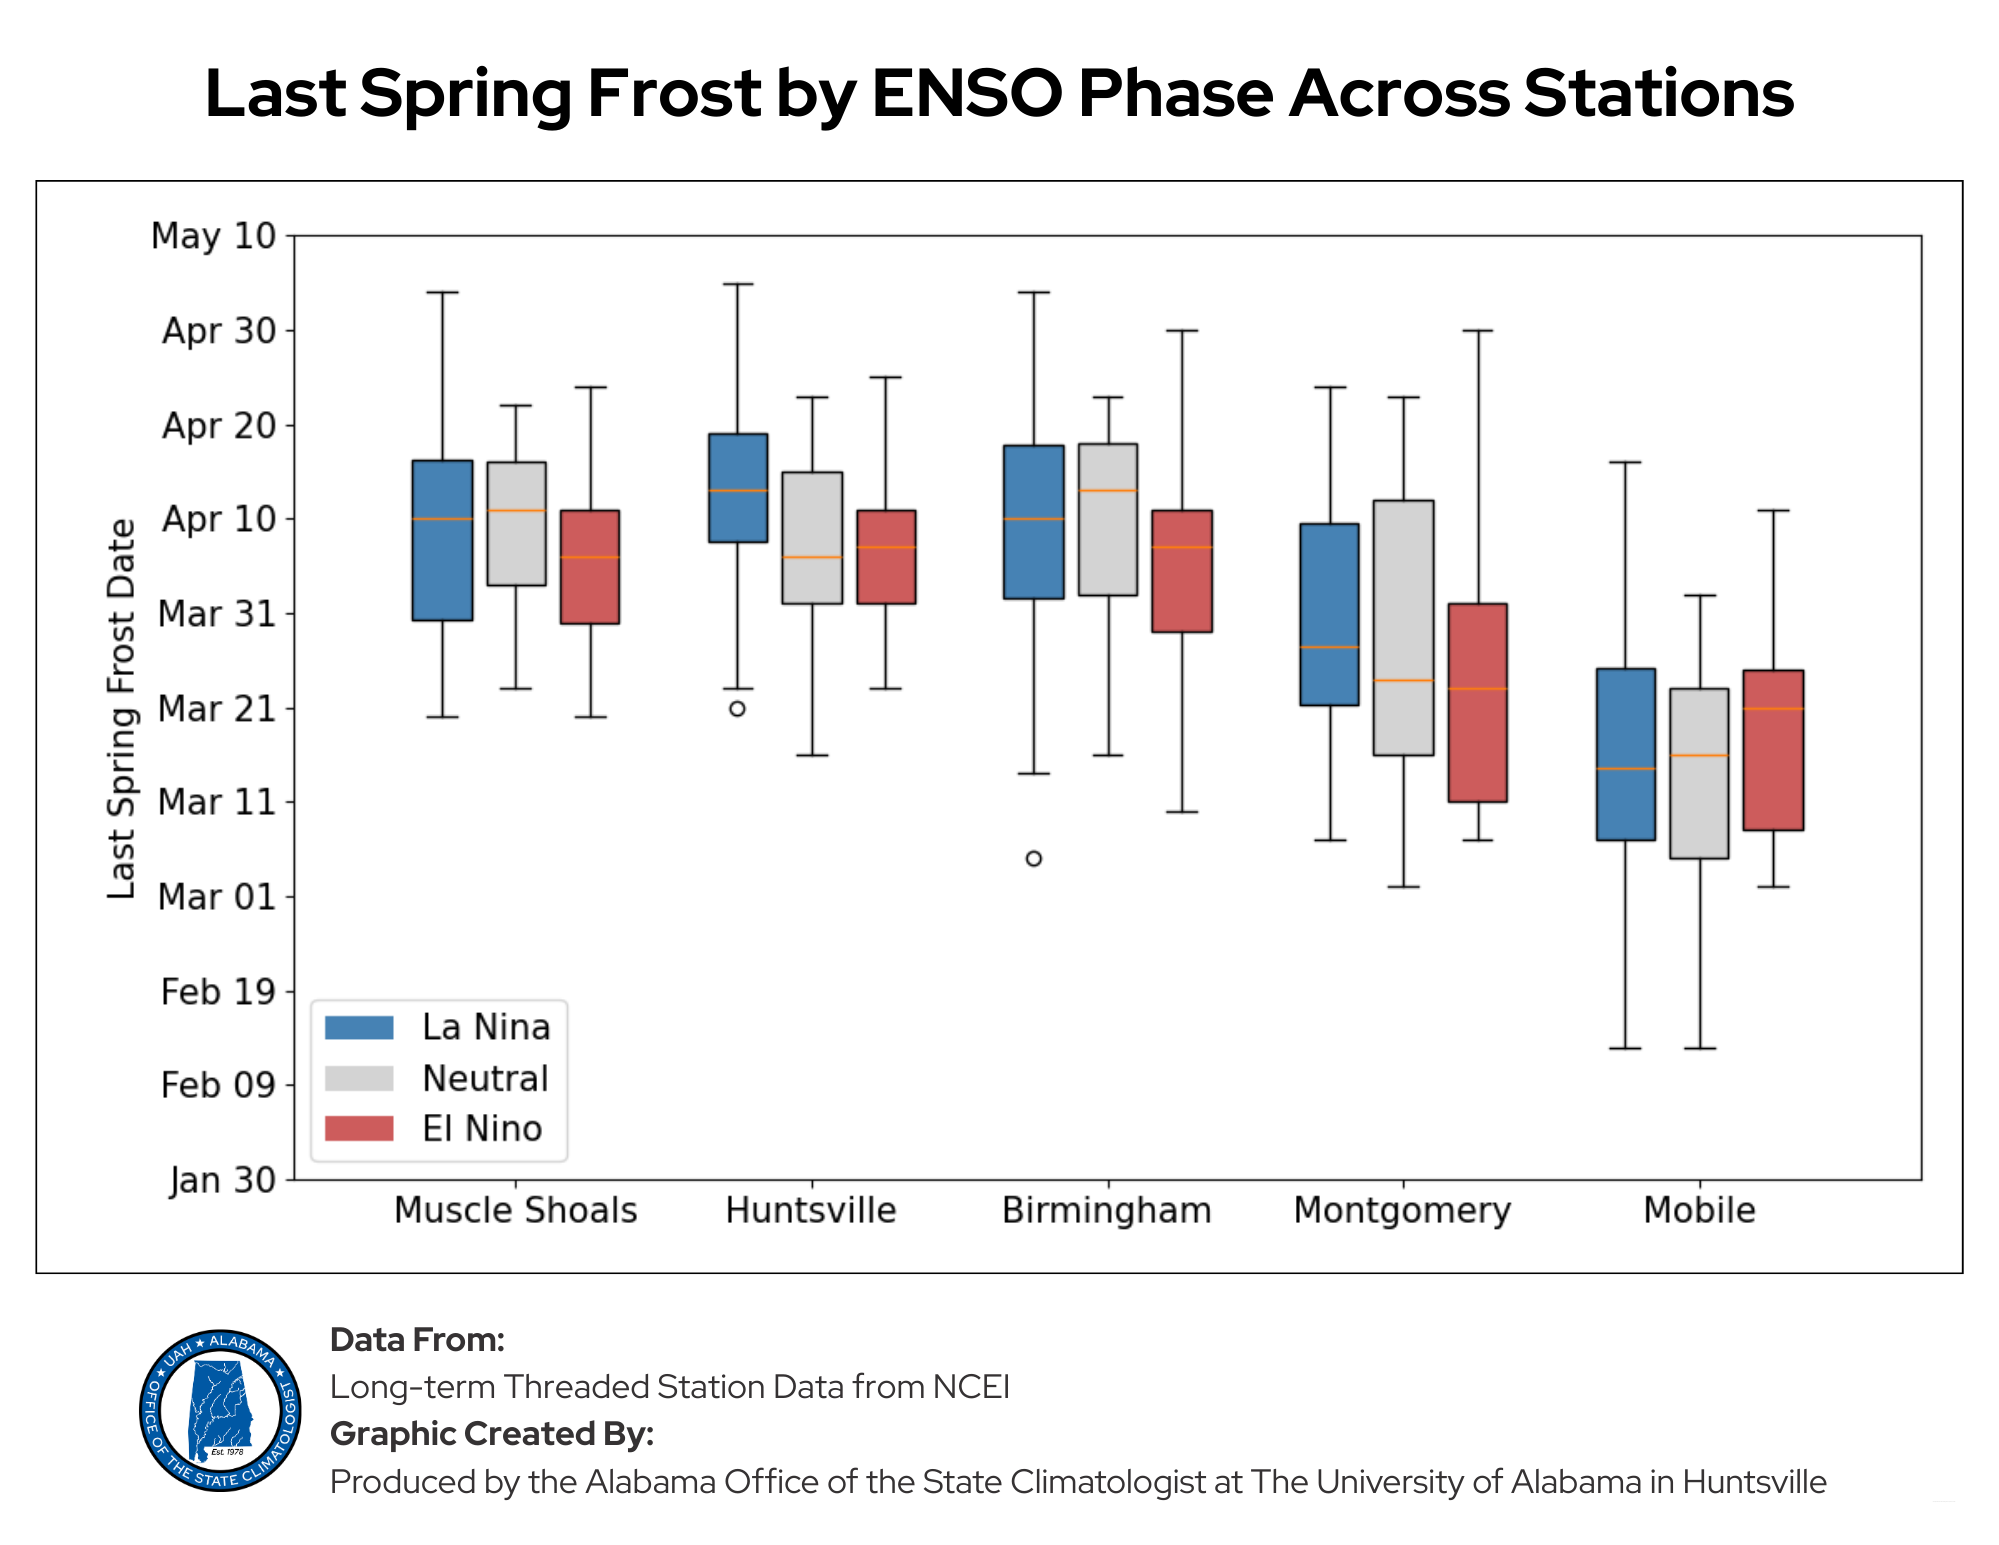
Folks often ask about ENSO signals and their influence on Alabama’s climate. ENSO (El Niño–Southern Oscillation) affects the position and strength of the jet stream over the Southeastern United States during winter and early spring. La Niña winters can favor more frequent intrusions of continental air into the Southeast, increasing the potential for late cold outbreaks, while El Niño winters often promote a stronger subtropical jet and relatively milder late-season conditions. However, this signal is generally modest in Alabama and tends to be more noticeable in our southernmost counties.
We examined the influence of ENSO on last freeze and frost dates over the past 75 years (1950-2025)*. Across the northern stations, there is very little difference in median freeze or frost timing between ENSO phases, and no consistent signal emerges in the data. However, the latest frosts recorded were usually in La Niña years. In Mobile, El Niño winters were associated with slightly later frost and freeze dates overall, but the differences are typically on the order of days rather than weeks. In short, ENSO may slightly tilt the odds for our coastal areas, but it does not eliminate the risk of late-season cold in Alabama (Figures 15 and 16).
*The ENSO data is from https://psl.noaa.gov/data/timeseries/month/DS/Nino34_CPC/ and Niño 3.4 is the area averaged anomalies over the Niño 3.4 region (5N-5S)(170-120W) using a climatology of 1981-2010.
| Earliest Last Freeze | Latest Last Freeze | Earliest Last Frost | Latest Last Frost | |||||||
| Station | Name | Date | Year | Date | Year | Date | Year | Date | Year | # Years of Recorded Data |
| USC00010160 | ALEXANDER CITY | 2/24 | 1997 | 4/27 | 1983 | 3/6 | 2012 | 5/4 | 1971 | 57 |
| USW00013871 | ANNISTON METRO AP | 2/18 | 2003 | 4/23 | 1986 | 3/6 | 2012 | 5/13 | 1960 | 123 |
| USC00010402 | ATMORE | 2/2 | 1949 | 4/13 | 1940 | 2/16 | 1997 | 4/16 | 2008 | 86 |
| USC00010505 | BANKHEAD L&D | 2/14 | 2011 | 4/21 | 1983 | 3/8 | 2019 | 5/5 | 1971 | 69 |
| USC00010583 | BAY MINETTE | 1/28 | 1946 | 4/6 | 2007 | 2/5 | 1918 | 4/19 | 1983 | 113 |
| USC00010655 | BELLE MINA 2 N | 3/7 | 2020 | 4/25 | 2005 | 3/22 | 2023 | 5/13 | 1960 | 77 |
| USC00010764 | BESSEMER 3 WSW | 2/25 | 2012 | 4/27 | 1993 | 3/6 | 2012 | 5/13 | 1997 | 49 |
| USW00013876 | BIRMINGHAM AP | 2/3 | 1945 | 4/23 | 1986 | 3/1 | 1945 | 5/4 | 1971 | 97 |
| USC00011080 | BREWTON 3 ENE | 2/14 | 2012 | 4/23 | 1993 | 3/1 | 2020 | 4/30 | 1992 | 49 |
| USC00011620 | CHILDERSBURG WTP | 3/2 | 2020 | 4/24 | 1986 | 3/20 | 2017 | 5/20 | 2002 | 69 |
| USC00011694 | CLANTON | 2/21 | 2012 | 4/26 | 1910 | 3/11 | 1995 | 5/13 | 1960 | 133 |
| USC00011725 | CLAYTON | 2/9 | 1976 | 5/5 | 2005 | 3/7 | 2019 | 5/5 | 2005 | 98 |
| USW00013839 | DOTHAN RGNL AP | 1/19 | 1997 | 4/4 | 1987 | 2/13 | 2012 | 4/16 | 2014 | 57 |
| USC00012813 | FAIRHOPE 2 NE | 1/14 | 1990 | 5/15 | 1926 | 2/10 | 1961 | 5/15 | 1926 | 109 |
| USC00012883 | FAYETTE | 3/8 | 2010 | 5/7 | 1944 | 3/17 | 1929 | 5/13 | 1960 | 134 |
| USC00013154 | GADSDEN | 2/16 | 2011 | 4/22 | 2021 | 3/6 | 2012 | 5/13 | 1960 | 73 |
| USC00013160 | GAINESVILLE LOCK | 2/15 | 2011 | 4/23 | 1986 | 3/7 | 2012 | 4/25 | 1986 | 78 |
| USC00013251 | GENEVA #2 | 2/4 | 2018 | 4/9 | 2000 | 2/18 | 1997 | 4/24 | 2012 | 50 |
| USC00013511 | GREENSBORO | 2/9 | 2000 | 4/19 | 1983 | 2/21 | 1903 | 4/28 | 1988 | 136 |
| USC00013519 | GREENVILLE | 2/8 | 1951 | 4/19 | 1983 | 3/1 | 1945 | 4/24 | 2012 | 126 |
| USC00013573 | GUNTERSVILLE | 2/13 | 2011 | 4/28 | 1976 | 3/5 | 2012 | 5/11 | 1989 | 122 |
| USC00013620 | HALEYVILLE | 3/4 | 2012 | 4/22 | 2021 | 3/11 | 1946 | 5/17 | 2007 | 124 |
| USC00013645 | HAMILTON 3 S | 3/21 | 2024 | 5/11 | 2020 | 4/2 | 1991 | 5/27 | 1979 | 65 |
| USC00013775 | HEFLIN | 3/8 | 2010 | 5/13 | 1960 | 3/30 | 2015 | 5/30 | 1984 | 71 |
| USW00003856 | HUNTSVILLE INTL AP | 2/26 | 2012 | 5/7 | 1944 | 3/16 | 2017 | 5/7 | 1944 | 68 |
| USC00014193 | JACKSON | 1/26 | 1990 | 4/17 | 2014 | 3/7 | 2020 | 4/25 | 2012 | 65 |
| USC00014502 | LAFAYETTE 2W | 3/9 | 1972 | 4/24 | 2024 | 3/18 | 1954 | 5/20 | 2002 | 82 |
| USC00015121 | MARION JUNCTION 2 NE | 2/15 | 2011 | 4/25 | 2005 | 3/1 | 2020 | 4/25 | 2005 | 76 |
| USW00013894 | MOBILE | 1/9 | 2017 | 4/5 | 1987 | 2/13 | 2012 | 4/15 | 2008 | 79 |
| USW00013838 | MOBILE DWTN AP | 12/15 | 1952 | 3/31 | 2003 | 1/30 | 1952 | 4/9 | 2000 | 78 |
| USW00013895 | MONTGOMERY AP | 2/11 | 1961 | 4/9 | 2000 | 3/1 | 2020 | 4/29 | 1992 | 79 |
| USC00015635 | MOULTON 2 | 3/7 | 2020 | 4/24 | 1986 | 3/25 | 1981 | 5/13 | 1960 | 69 |
| USW00013896 | MUSCLE SHOALS RGNL AP | 2/23 | 1953 | 4/15 | 2008 | 3/11 | 1946 | 5/7 | 1944 | 86 |
| USC00016121 | ONEONTA | 3/1 | 1945 | 5/10 | 1906 | 3/22 | 2016 | 5/15 | 1917 | 132 |
| USC00016129 | OPELIKA | 2/26 | 2012 | 4/27 | 1977 | 3/22 | 2023 | 5/28 | 1961 | 69 |
| USC00017025 | ROCK MILLS | 3/6 | 2012 | 5/5 | 1971 | 3/30 | 1948 | 5/21 | 2002 | 88 |
| USC00017131 | RUSSELLVILLE #2 | 3/4 | 2012 | 5/13 | 1960 | 3/6 | 2016 | 6/4 | 1969 | 73 |
| USC00017157 | SAINT BERNARD | 3/6 | 2012 | 5/5 | 1976 | 3/18 | 1929 | 5/18 | 1973 | 119 |
| USC00017207 | SAND MT SUBSTN | 2/25 | 2012 | 4/24 | 2021 | 3/22 | 2023 | 5/19 | 2005 | 78 |
| USC00017304 | SCOTTSBORO | 3/9 | 2010 | 5/10 | 1906 | 3/19 | 1926 | 5/14 | 1917 | 135 |
| USC00017366 | SELMA | 1/27 | 1990 | 4/26 | 1910 | 2/21 | 2012 | 4/26 | 1910 | 132 |
| USC00017999 | SYLACAUGA 4 NE | 3/6 | 2012 | 4/24 | 1986 | 3/22 | 2023 | 5/13 | 1960 | 76 |
| USC00018024 | TALLADEGA | 2/28 | 1935 | 5/4 | 1971 | 3/18 | 1929 | 5/18 | 1924 | 138 |
| USC00018209 | THORSBY EXP STN | 2/20 | 2024 | 4/19 | 1983 | 3/1 | 2020 | 4/24 | 2005 | 69 |
| USC00018323 | TROY | 2/4 | 2018 | 4/19 | 1983 | 2/17 | 1997 | 4/25 | 1910 | 118 |
| USW00093806 | TUSCALOOSA MUNI AP | 2/24 | 1976 | 4/21 | 1953 | 3/7 | 2020 | 5/4 | 1976 | 78 |
| USC00018469 | VALLEY HEAD | 3/9 | 2010 | 5/30 | 1984 | 3/31 | 1911 | 5/31 | 1984 | 134 |
| USC00018517 | VERNON | 3/4 | 2012 | 5/4 | 1976 | 3/21 | 2023 | 5/18 | 1973 | 88 |
| USC00018998 | WINFIELD 2 SW | 3/7 | 2020 | 5/4 | 1994 | 3/31 | 2023 | 5/7 | 2016 | 103 |