U.S. climate sees declines in both hot and cold extreme temperatures since 1899
Metrics such as the hottest annual temperatures, number of daily heat records and heatwave days show modest declines since 1899. The most intense nationwide heat events remain concentrated in the 1925–1954 period, especially the 1930s.
A comprehensive new study extending the U.S. Historical Climatology Network (USHCN) record back to 1899 finds that both hot and cold temperature extremes across the contiguous United States have declined over the past 127 years. The research, performed by Dr. John R. Christy, Alabama State Climatologist (retired) and professor of atmospheric and earth science at The University of Alabama in Huntsville, a part of The University of Alabama System, analyzed more than 40 million daily temperature observations to provide the most complete long-term view to date of U.S. extreme heat and cold. The paper is published in Theoretical and Applied Climatology.
Drawing on 1,211 of the best weather stations in the lower 48 states, many of which required extensive reconstruction from nearby correlated stations, the study evaluates when and where the nation’s hottest and coldest days occurred, how often daily records were set and how the frequency of heatwaves and cold waves has evolved since the late 19th century.
Building the dataset took years of tedious effort, requiring manually sifting through thousands of original forms to fill in the large gaps present in the NOAA datafiles currently available to researchers.
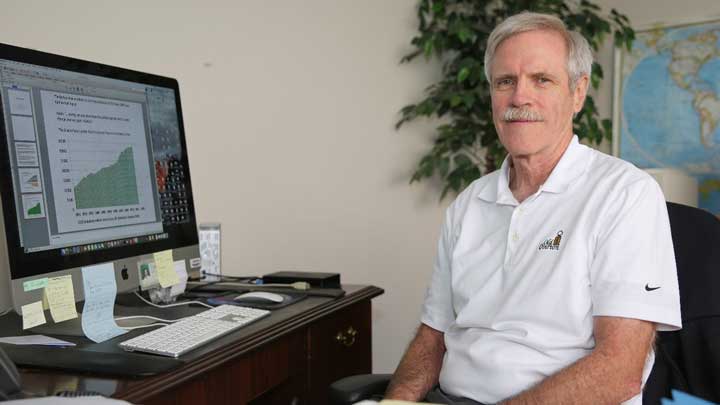
A Distinguished Professor of Atmospheric and Earth Science and Director of the Earth System Science Center at The University of Alabama in Huntsville, Dr. John Christy is widely recognized for his scientific leadership, public service and contributions to climate research at the national and international level.
“It was a labor of love and curiosity,” Christy says. He still retains his own observations started in the 1960s in Fresno, Calif. “This paper demonstrates that Fresno is a prime example of how growing cities have skewed temperature records over the decades with nighttime minima now over 5°F warmer in the city than experienced by surrounding stations.”
Extreme summer heat has not increased. Metrics such as the hottest annual temperatures, number of daily heat records and heatwave days show modest declines since 1899. The most intense nationwide heat events remain concentrated in the 1925–1954 period, especially the 1930s.
Extreme cold has decreased sharply. Since the 1990s, the frequency and severity of record-cold winter temperatures have dropped substantially. The study notes that this decline may reflect both atmospheric warming and the influence of human development around weather stations, which tends to raise nighttime minimum temperatures in particular.
Overall extremes have become less extreme. The difference between the hottest and coldest annual temperatures for all stations has narrowed by about 6°F over the full record, indicating a long-term reduction in temperature volatility.
Regional patterns matter. Western U.S. regions have seen substantial increases in heatwave activity in the past decade, while central and eastern regions show long-term declines. When averaged nationally, these opposing trends offset each other. Natural variability remains dominant. The magnitude of early-20th-century heat extremes – especially the 1930s – continues to exceed recent events, underscoring the strong role of natural climate variability in shaping U.S. temperature extremes.
The study also demonstrates how this dataset can be used to evaluate public claims about extreme weather. For example, while the National Climate Assessment #5 states that heatwaves have increased since the 1960s, Christy’s analysis finds that the national trend is small and statistically insignificant, though increases are evident in parts of the West. However, when extended back to 1899, heat extremes have actually declined nationwide.
“This dataset allows us to ask – and answer – questions about extreme heat and cold with more confidence, given the amount of data available now,” Christy notes. “Understanding how extremes have changed over time is essential for interpreting (dispassionately) how today’s events actually compare with the past.”