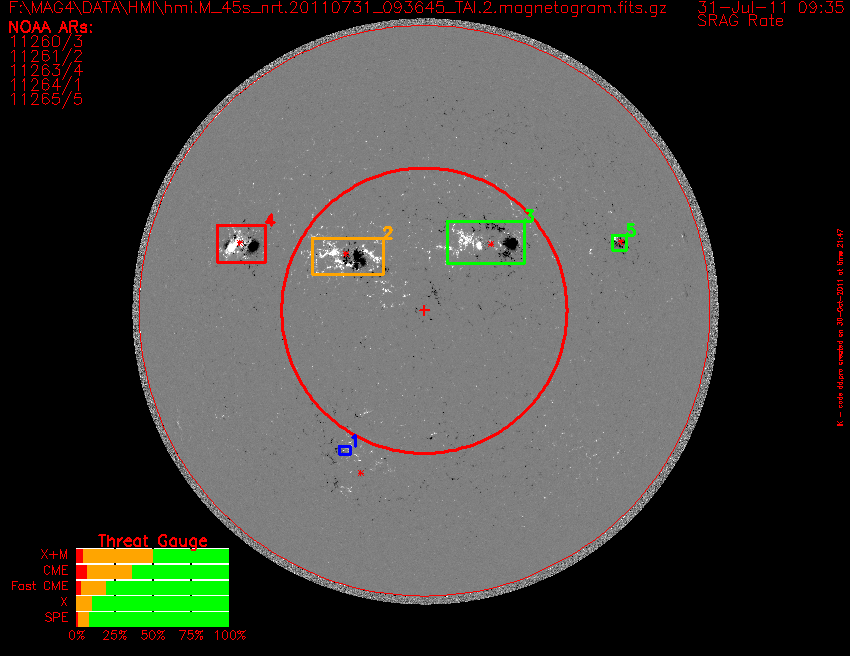
The MAG4 tool makes a forecast from a magnetogram, a magnetic map of the Sun. The magnetogram is shown as a gray image with white representing 500 G, and black representing -500 G. There are two red circles, the outer one is the solar limb, and the inner one is the inner 30 heliocentric degree disk, where the line-of-sight approximation is best, and the uncertainty in measuring the free-energy proxy used for forecast is least. Between the inner and outer circle projection effects can result in either underestimate or overestimate of the free-energy proxy, and thus predicted rate. The red plus in the center indicated disk center.
The date and time of the magnetogram is given in the upper right corner. The full-disk threat gauge is given in lower-right, description will be given later. The filename of the fits file used is given in the upper-left coroner. Under that is a list of active regions NOAA has numbered, a red asterisk is placed on the magnetogram, at the location of each of these active regions, and if the MAG4 tool has identified a strong magnetic field area, the number of the polygon is assigned to the active region after the slash.
The polygons are rectangles, excepts if two rectangles would overlap, in which case, one of both polygons are altered as needed to eliminated the overlap. The subfield enclosed by each rectangle is used to derive our free-energy proxy. The free-energy proxy is then converted to five different types of predicted event rates (Falconer et at 2011). Each polygon is color coded, blue indicate polygons without an assigned NOAA active region, while the other three colors are of polygons with at least 1 assigned NOAA active regions, and are based on predicted X&M flare rate (red > 0.2 events/day, yellow between 0.02 and 0.2 events per day, green < 0.02 events/day).
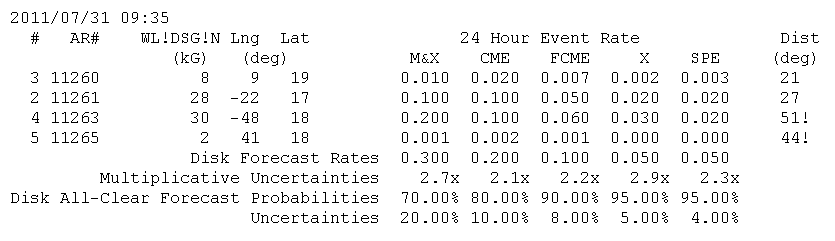
The value of the free-energy proxy for each polygon, and predicted event rates are given in the forecast text file (available on link lower-right or Near Real Time page). The format is the following. The first line gives date and time of magnetogram. Then for each active-region polygon the following information is given, polygon number, active region number, value of free-energy proxy (units are kilo Gauss), active region location, predicted X&M flare rate, CME rate, fast CME (CME with speeds greater than 800 km/s, X-class flare rate, and Solar Particle Event Rate), as well as distance the active region is from disk center. If more than two or more numbered NOAA active regions are in same polygon, then a '+' is added after the active region number, if the active region is greater than 30 degrees from disk center, then a ! is added as a warning, that both the free energy proxy and predicted event rates could be subjected to projection effects which might increase or decrease the measured value of the free-energy proxy and the resulting predicted event rates. All event rates are given to 1 significant digit.
The row below the last active region row has the full-disk event rate, which is the summation of each polyfon event rate. Next is the multiplicative uncertainty of the full-disk event rate which is the uncertainty of the active region with the largest free-energy proxy, and includes measurement uncertainty, uncertainty of converting the free-energy proxy into a predicted rate (a multiplicative uncertainty of 2, means we know the predicted rate to within a factor of 2). The full-disk predicted event rate is then converted into a disk all-clear forecast probability, the change no such event will occur. Below that is the uncertainty of the disk all-clear forecast.
The threat gauge on the figure is determined from the disk all-clear forecast probability and its uncertainty. The yellow part spans the 1 sigma error bars of the disk forecast probability (1-disk all-clear forecast probability), with any part of the bar to the left being red, and any part of the bar to the right being green. A low risk day would have all bars green, while high risk days will have the upper bars being primary red and yellow, while the lower bars have significant red and yellow.