Written by: Brianne Minton
With Technical Expertise From: Dr. Lee Ellenburg & Dr. Rob Junod
Fall is a great time to plant in Alabama, but knowing how much time you have before the first frost or freeze can help you decide what to plant and when. Cool-season vegetables, cover crops, lawns, and many other plants can benefit from Alabama’s fall weather, but they still need enough time to get established before temperatures drop. A frost or freeze that arrives earlier than expected can damage young plants, while a later first freeze can give you a longer growing season.
The timing of that first frost and freeze varies across Alabama. Northern Alabama and higher elevations typically see colder temperatures first, while southern Alabama and the Gulf Coast often stay warmer later into the fall. These dates are based on historical averages, so the weather in any given year can be different. Knowing when the first frost and freeze usually occur can give gardeners and growers a useful starting point for planning fall planting.
As the season changes, it is important to monitor short-term forecasts and stay updated with your local National Weather Service office, which often issues Freeze Warnings and Frost Advisories when conditions warrant. For guidance on protecting plants and preparing for freeze and frost conditions, we encourage you to contact your local Alabama Extension office for information tailored to your specific area and growing needs. If you have questions about this data, feel free to reach out to the Alabama Office of the State Climatologist at aosc@uah.edu. Read on for a closer look at when the first frost and freeze typically occur across Alabama and what the historical records tell us about the fall growing season.
Average First Frost and Freeze Dates
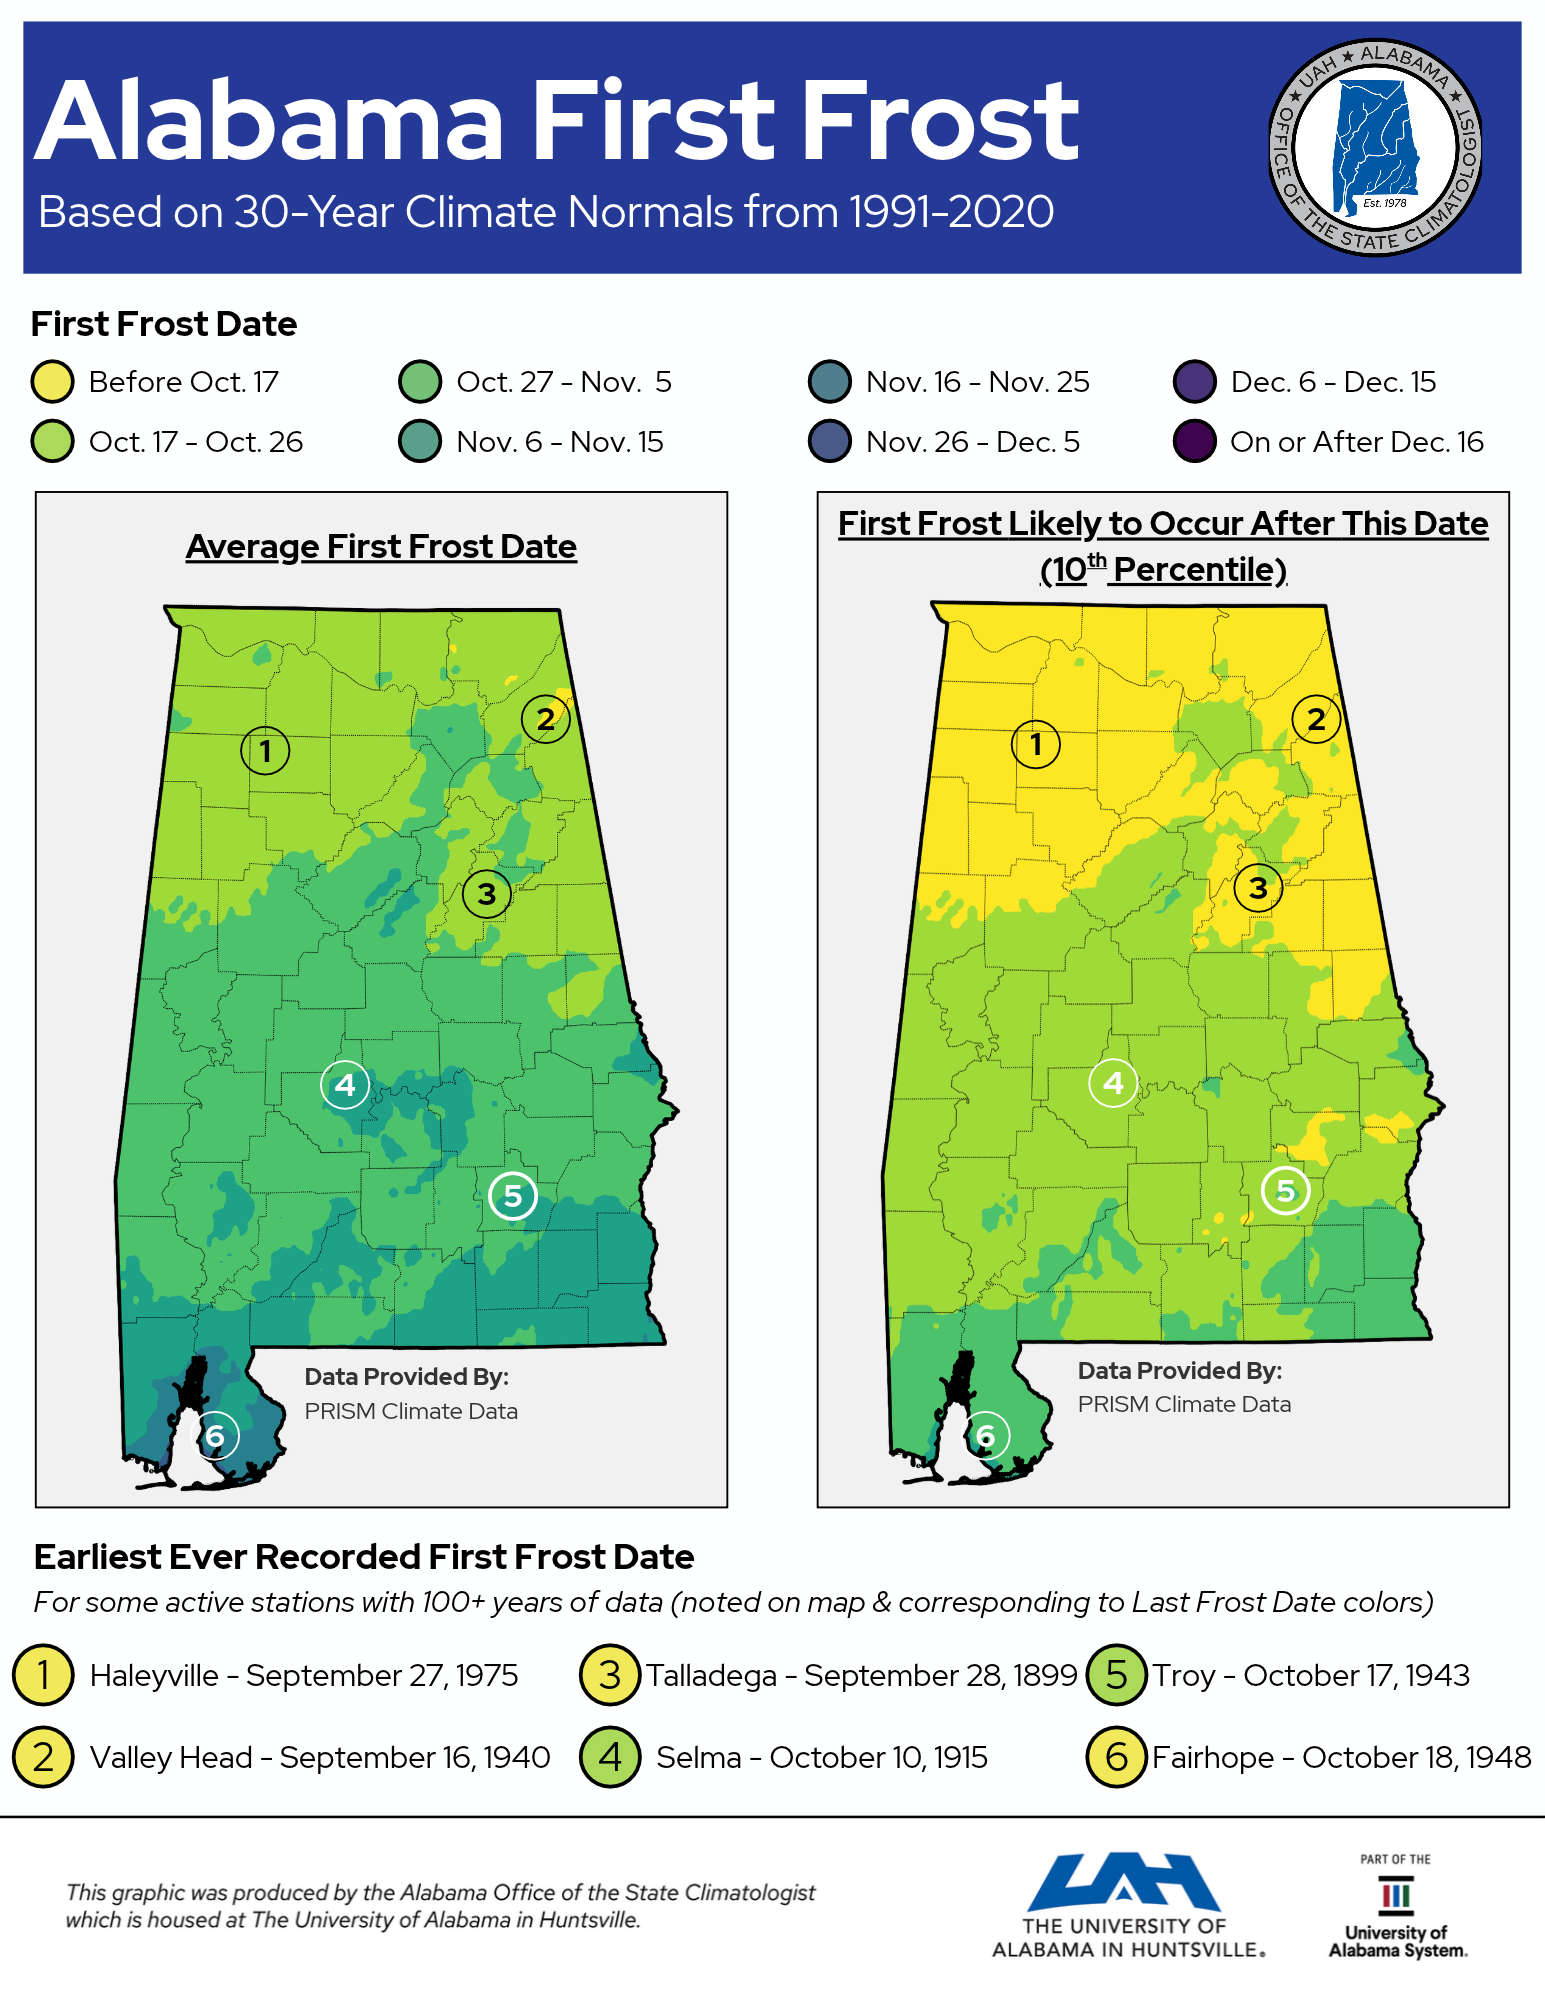
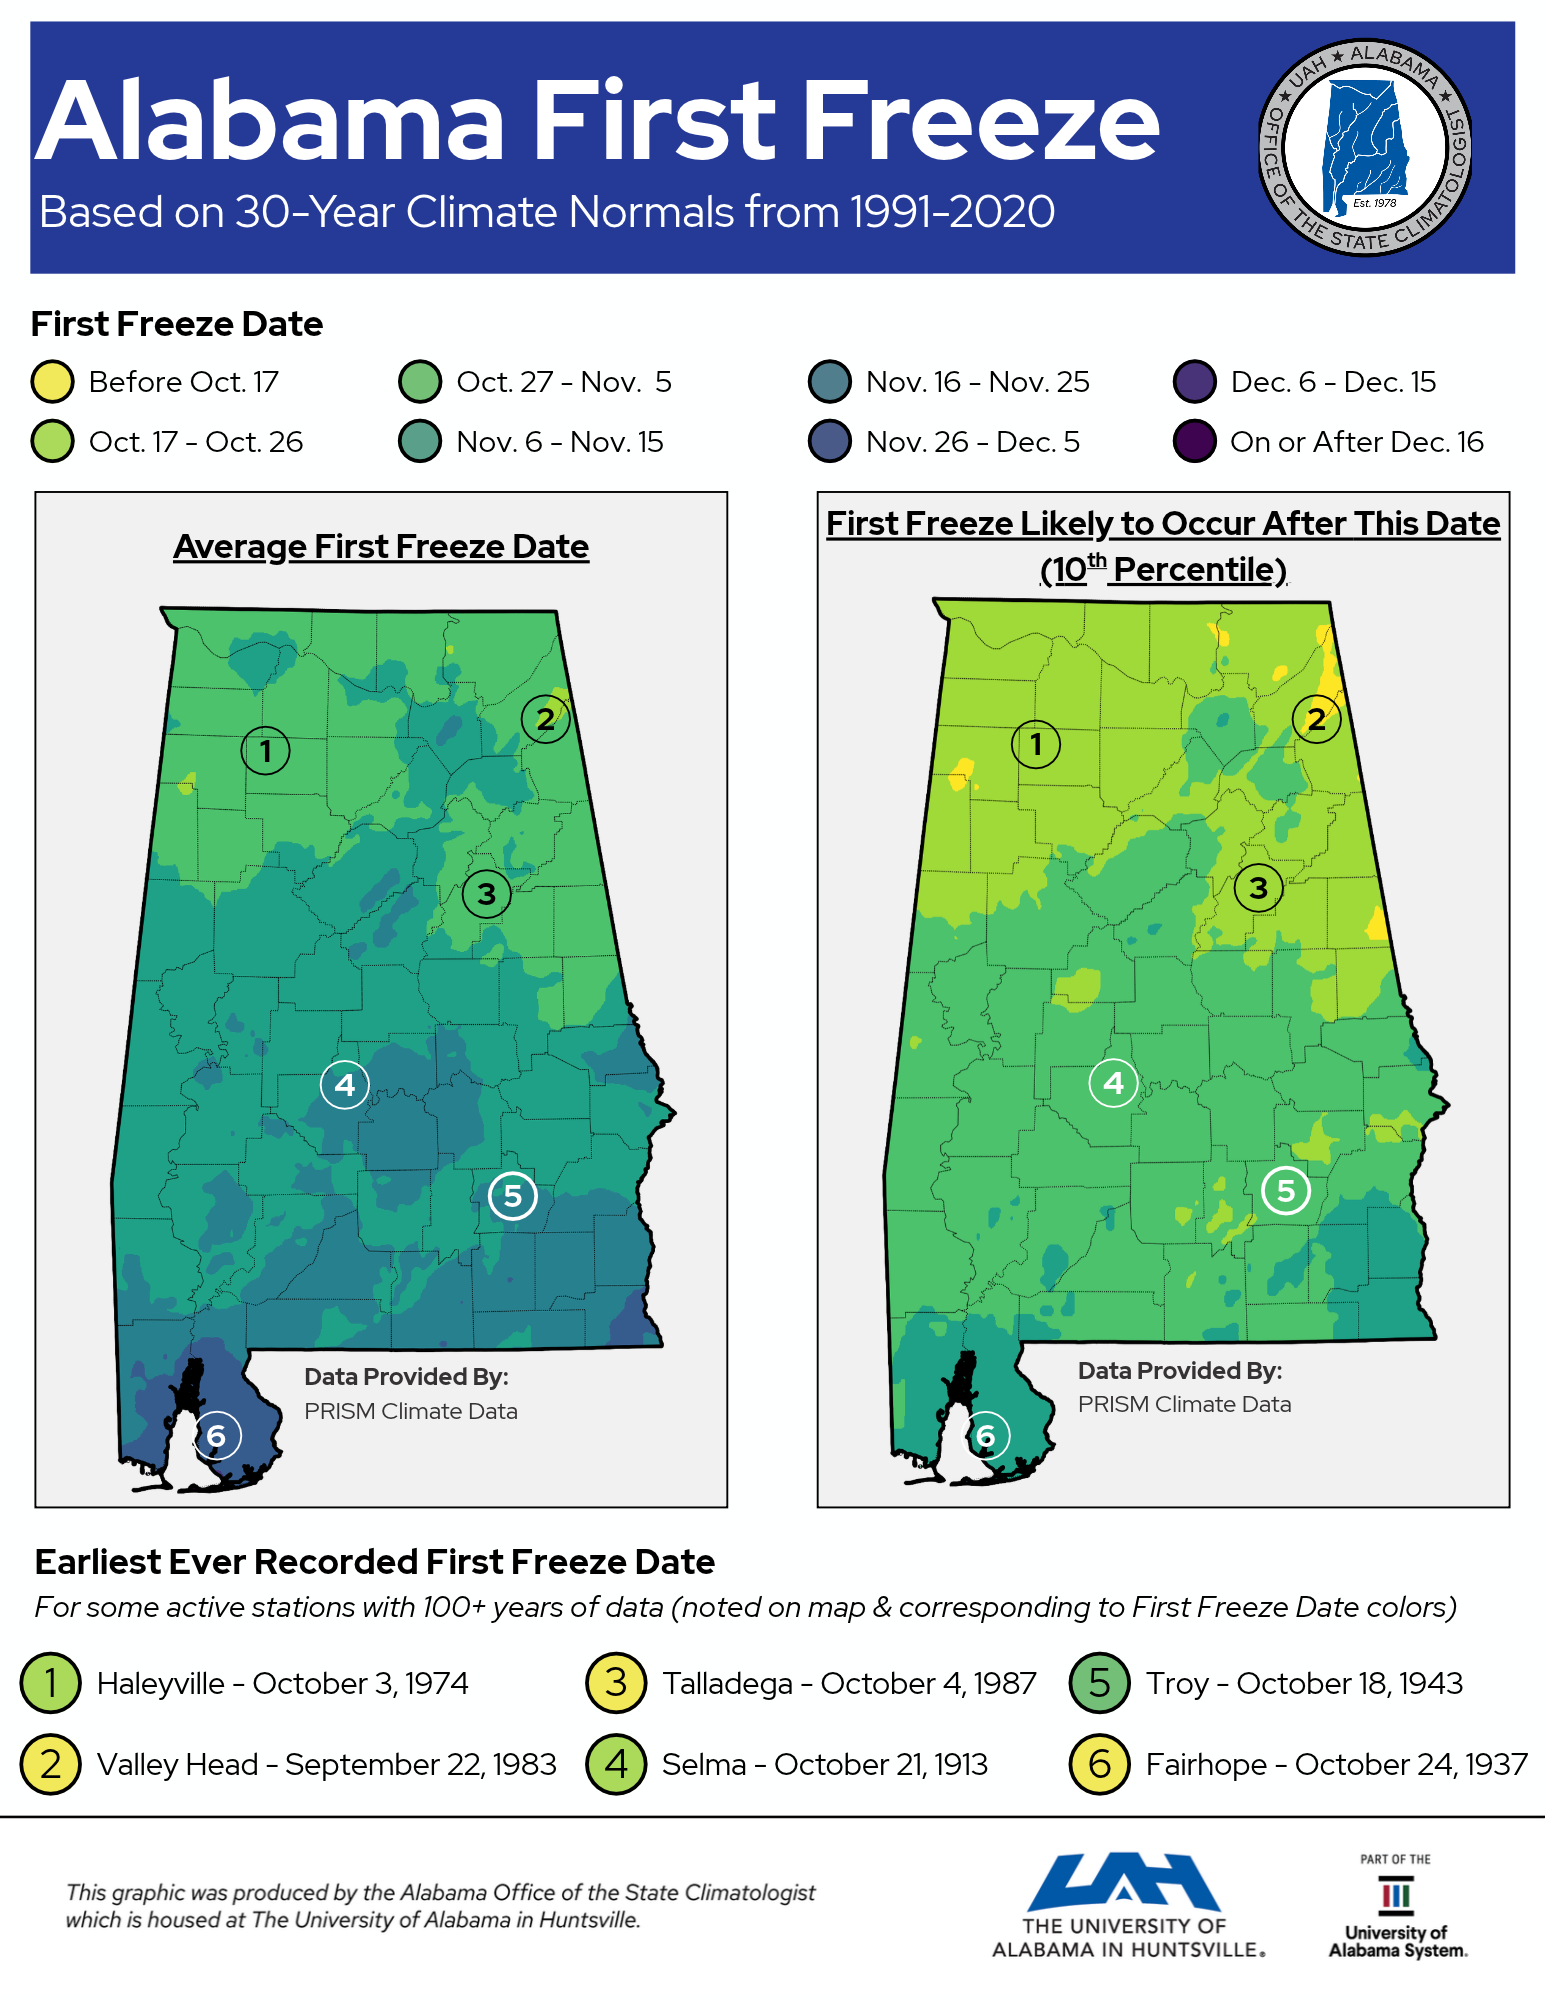
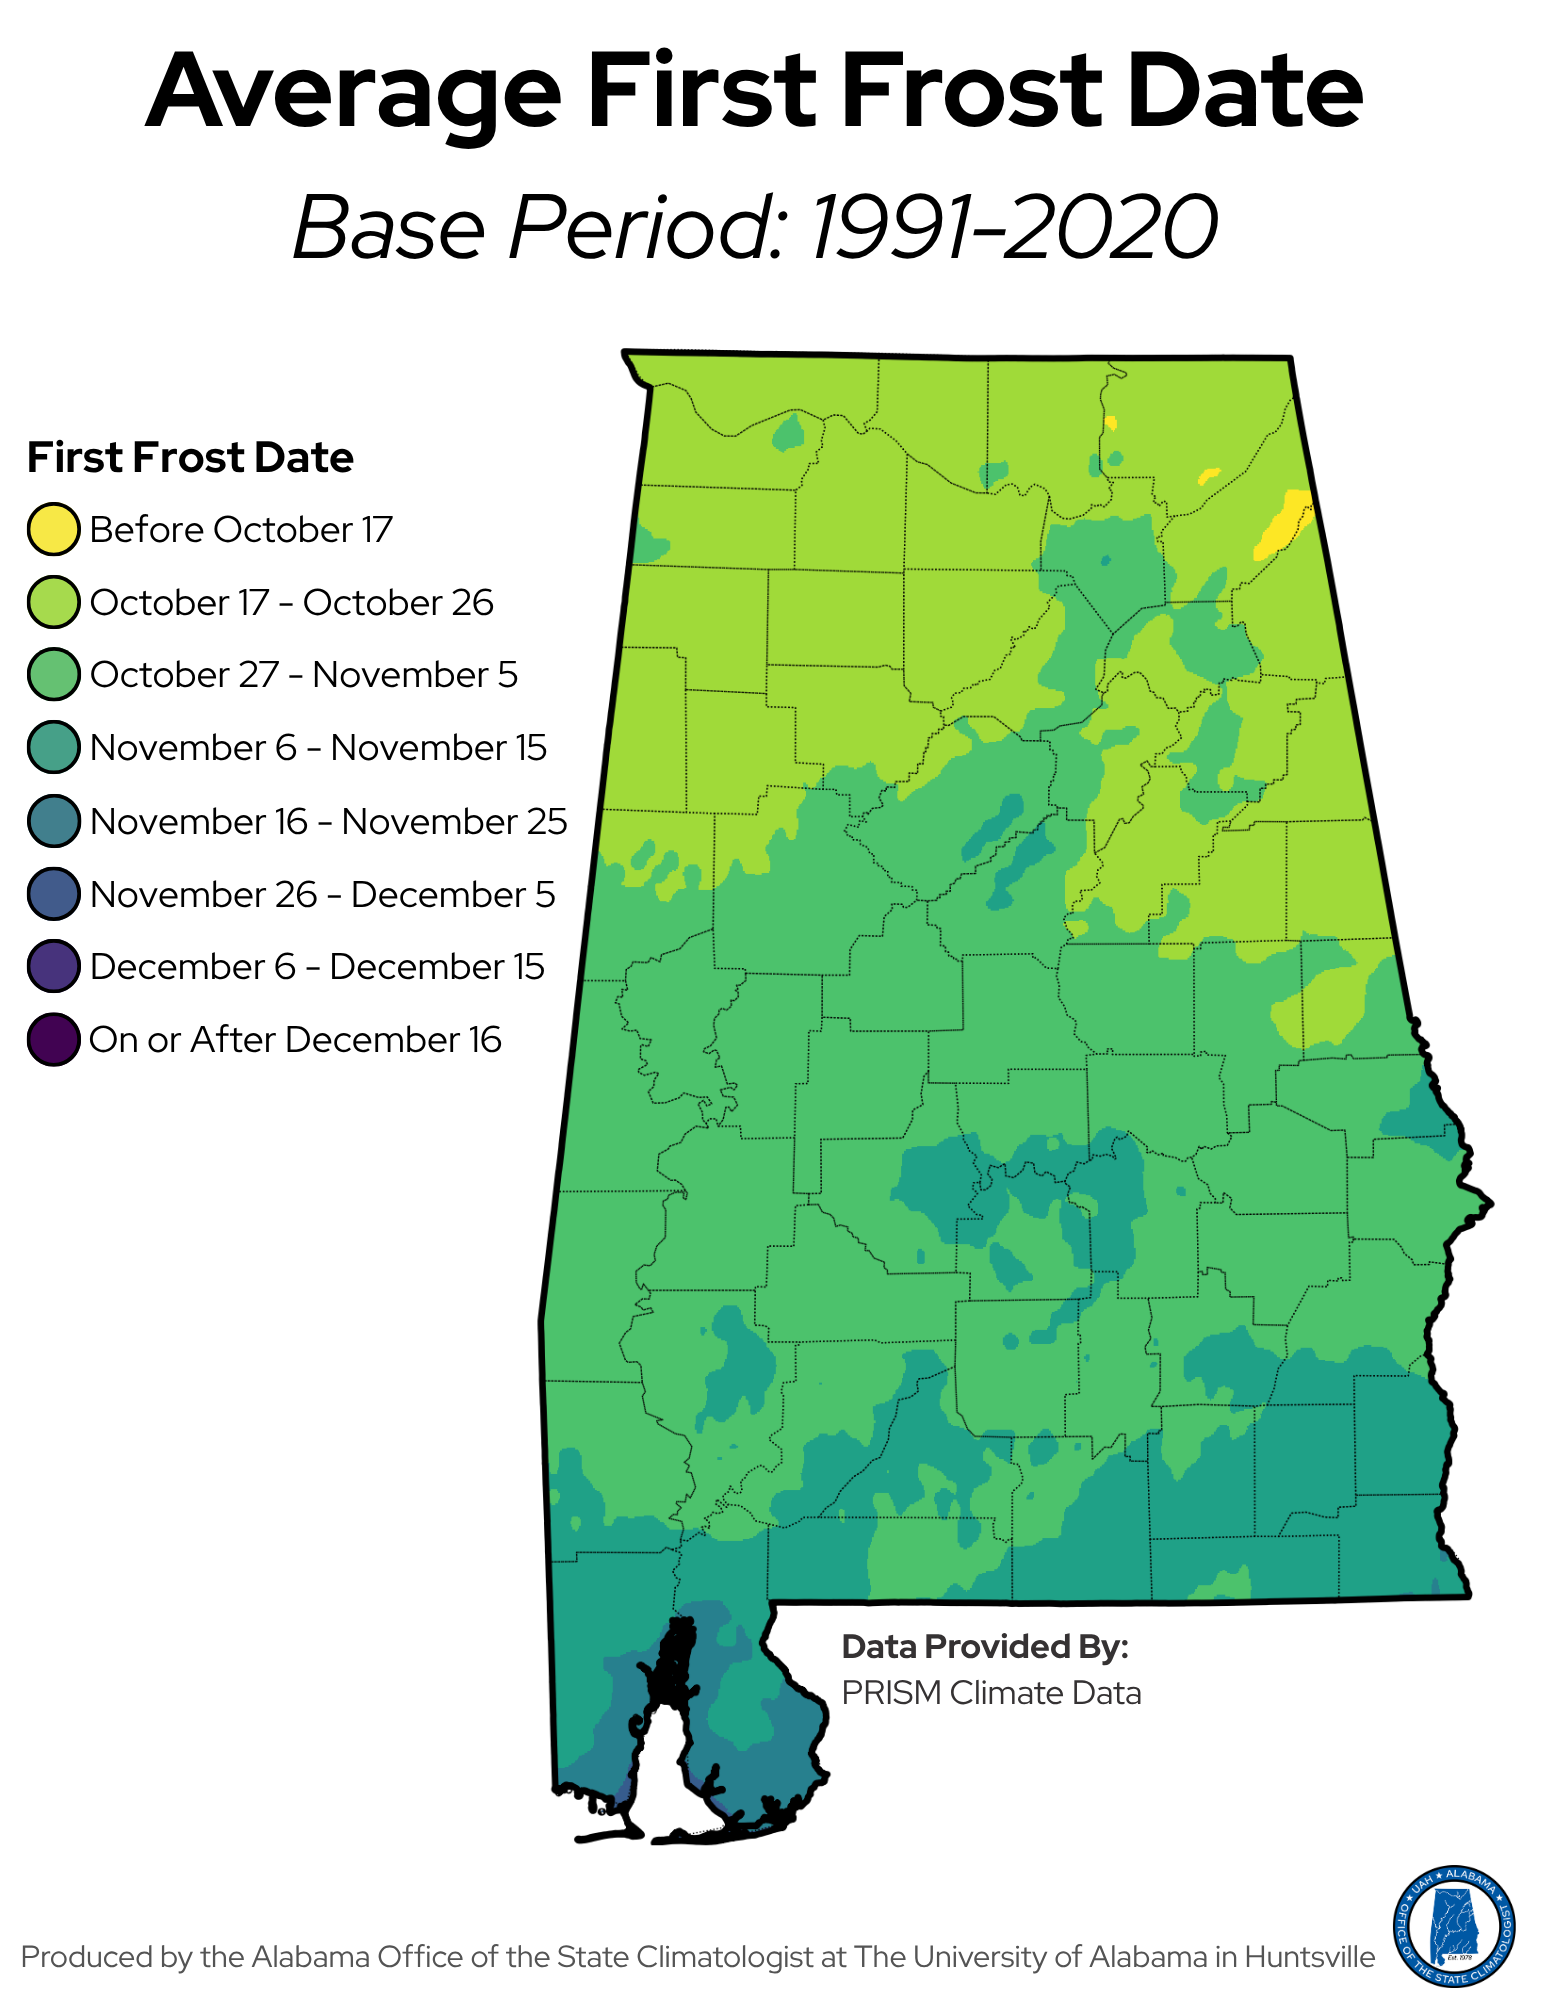
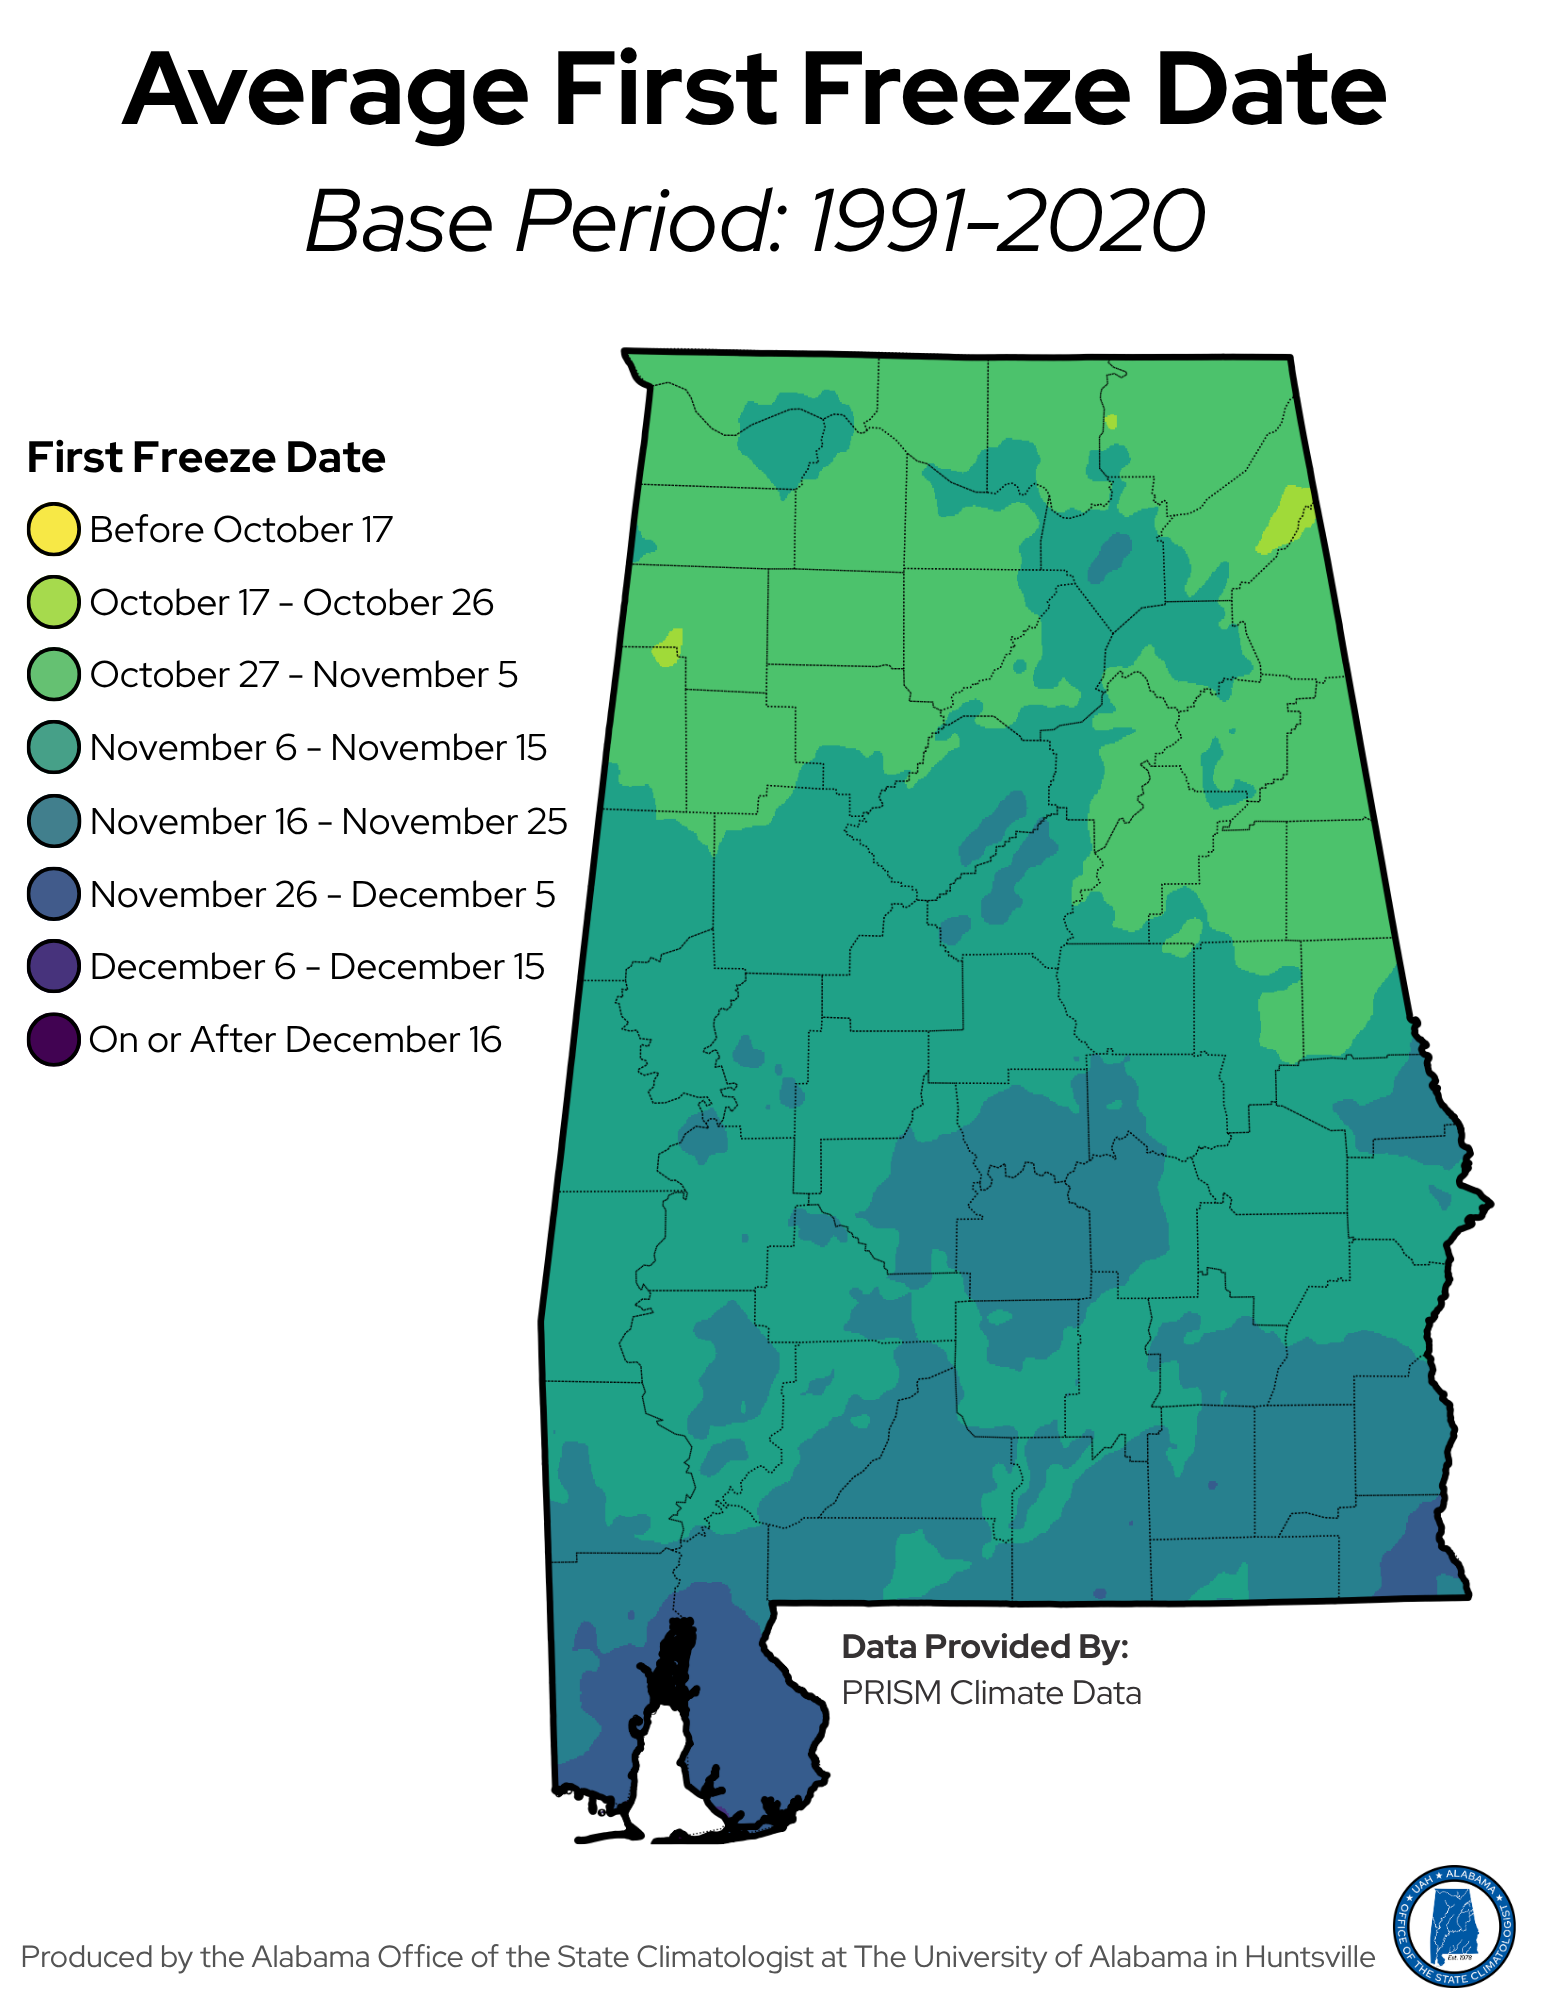
Figures 3 and 4 show the average first frost and first freeze dates based on the 1991–2020 climate normals from PRISM weather data. These normals represent the average conditions over a 30-year period (what we call a “climate normal”) and help show the typical timing of the first frost and freeze across Alabama.
The average first frost date ranges from late October in parts of northern Alabama to late November across much of southern Alabama. The first freeze generally occurs later, with average dates ranging from early November in northern Alabama to late November or early December in southern Alabama. A few small areas can see their first freeze as early as late October, including parts of north Lamar County, far eastern Jackson County, and eastern DeKalb County.
These average dates provide a useful starting point for fall planting and garden planning, but they are not a guarantee of when frost or freezing temperatures will occur in a given year. First frost and freeze dates can vary considerably from year to year, so it is important to keep an eye on the forecast as fall progresses.
Understanding Risk: 25th and 10th Percentiles
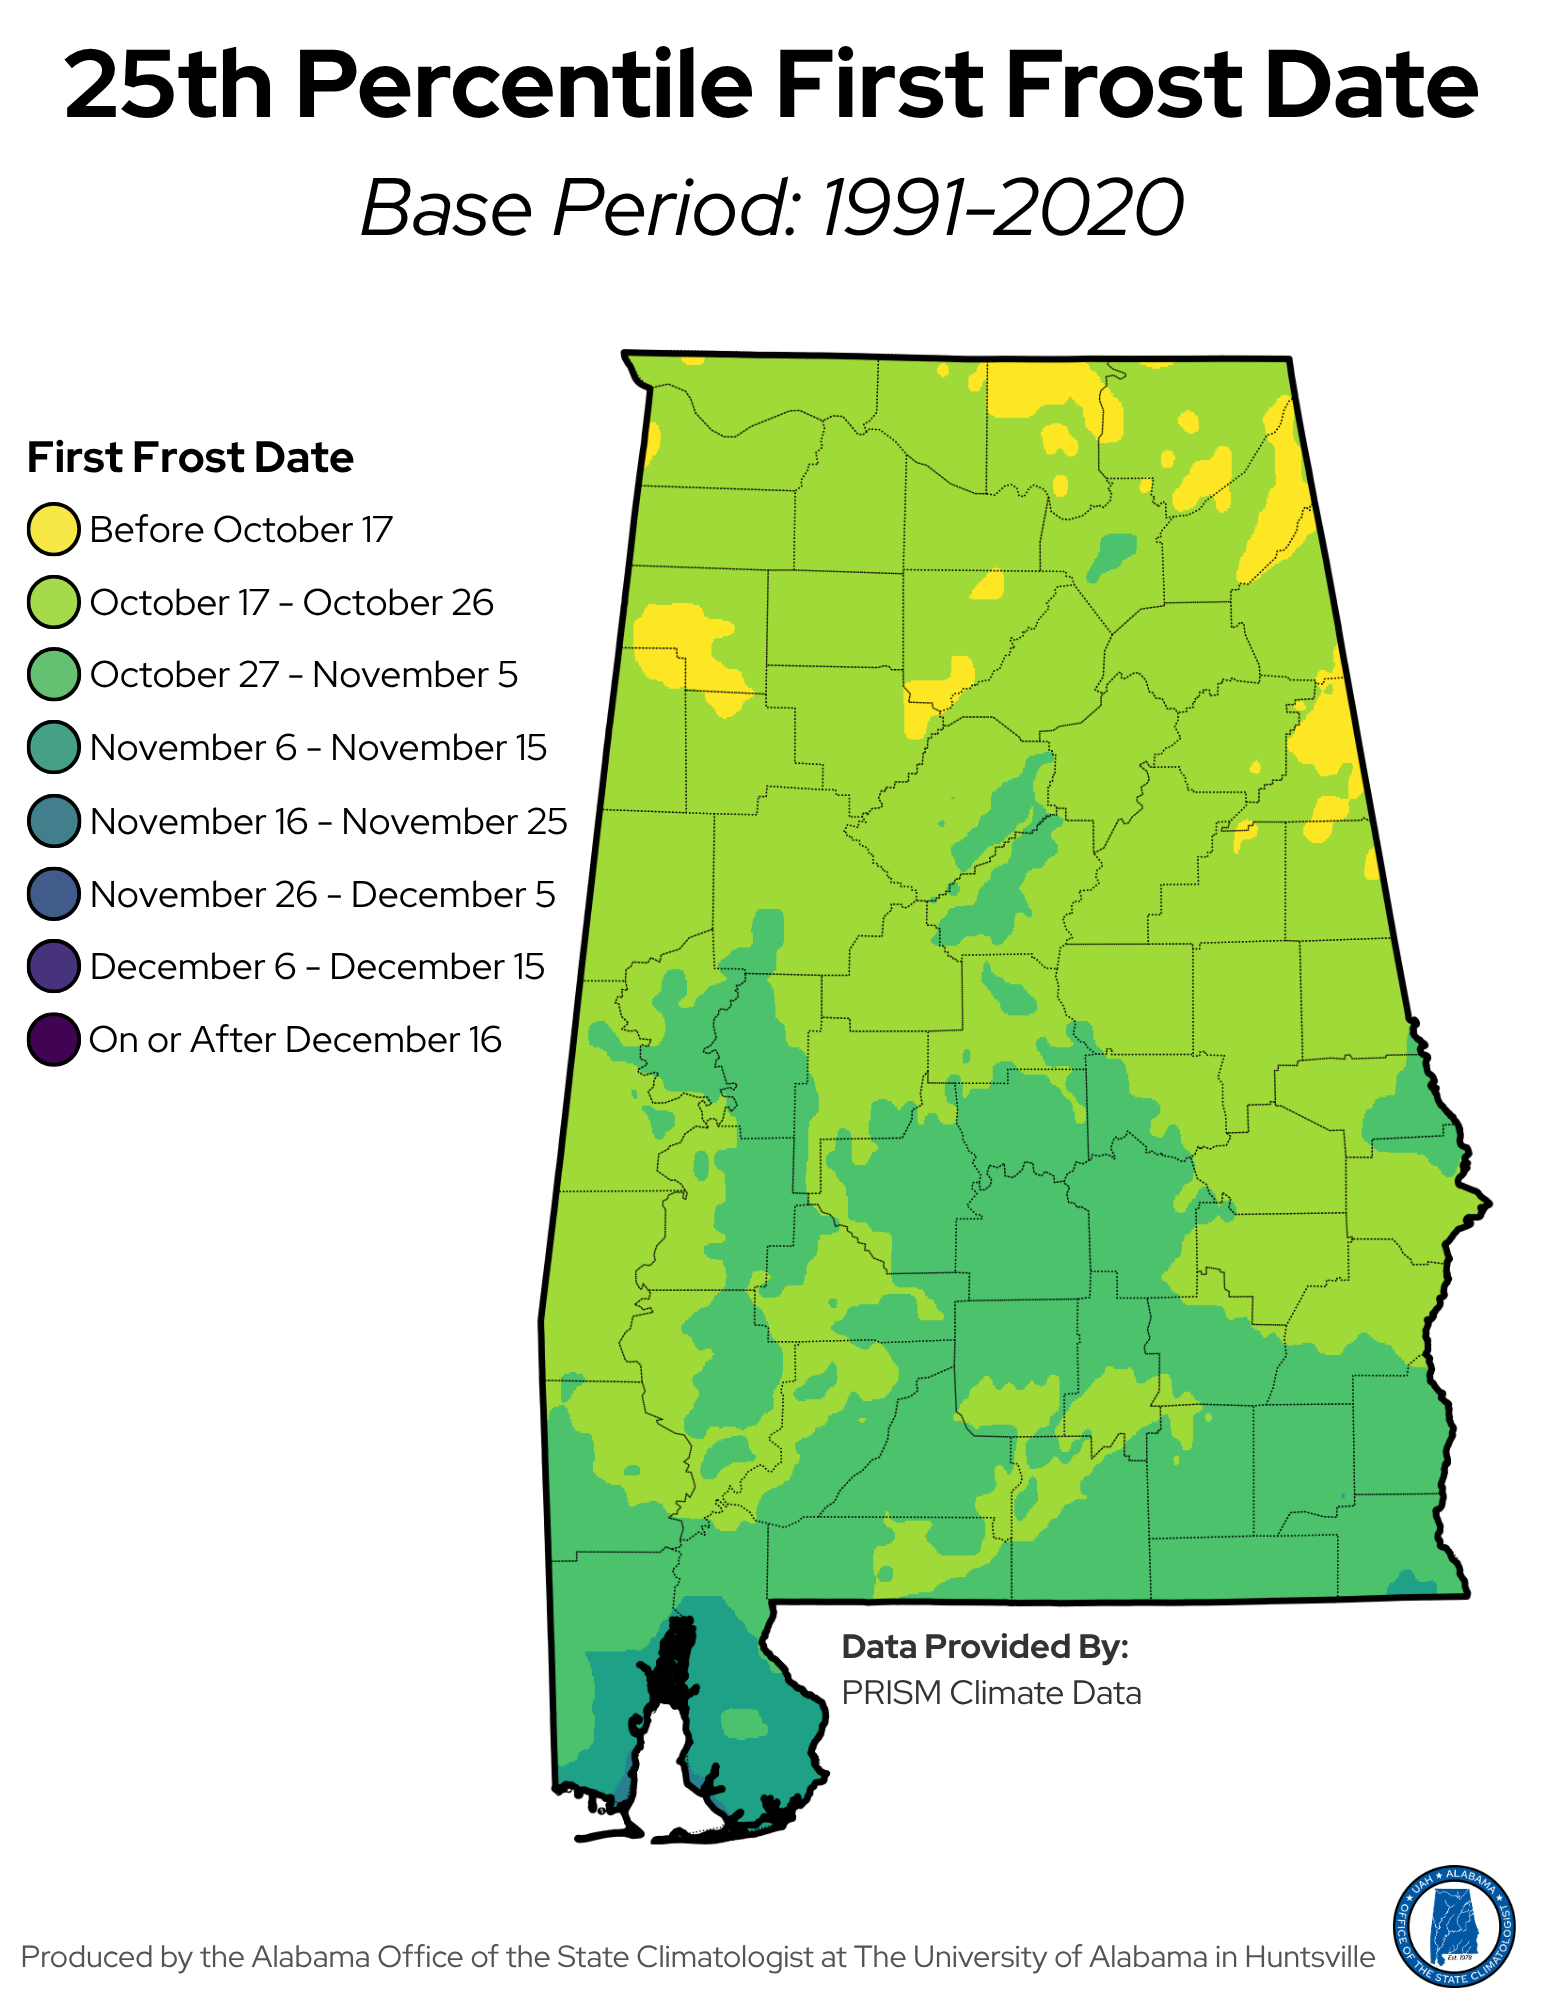
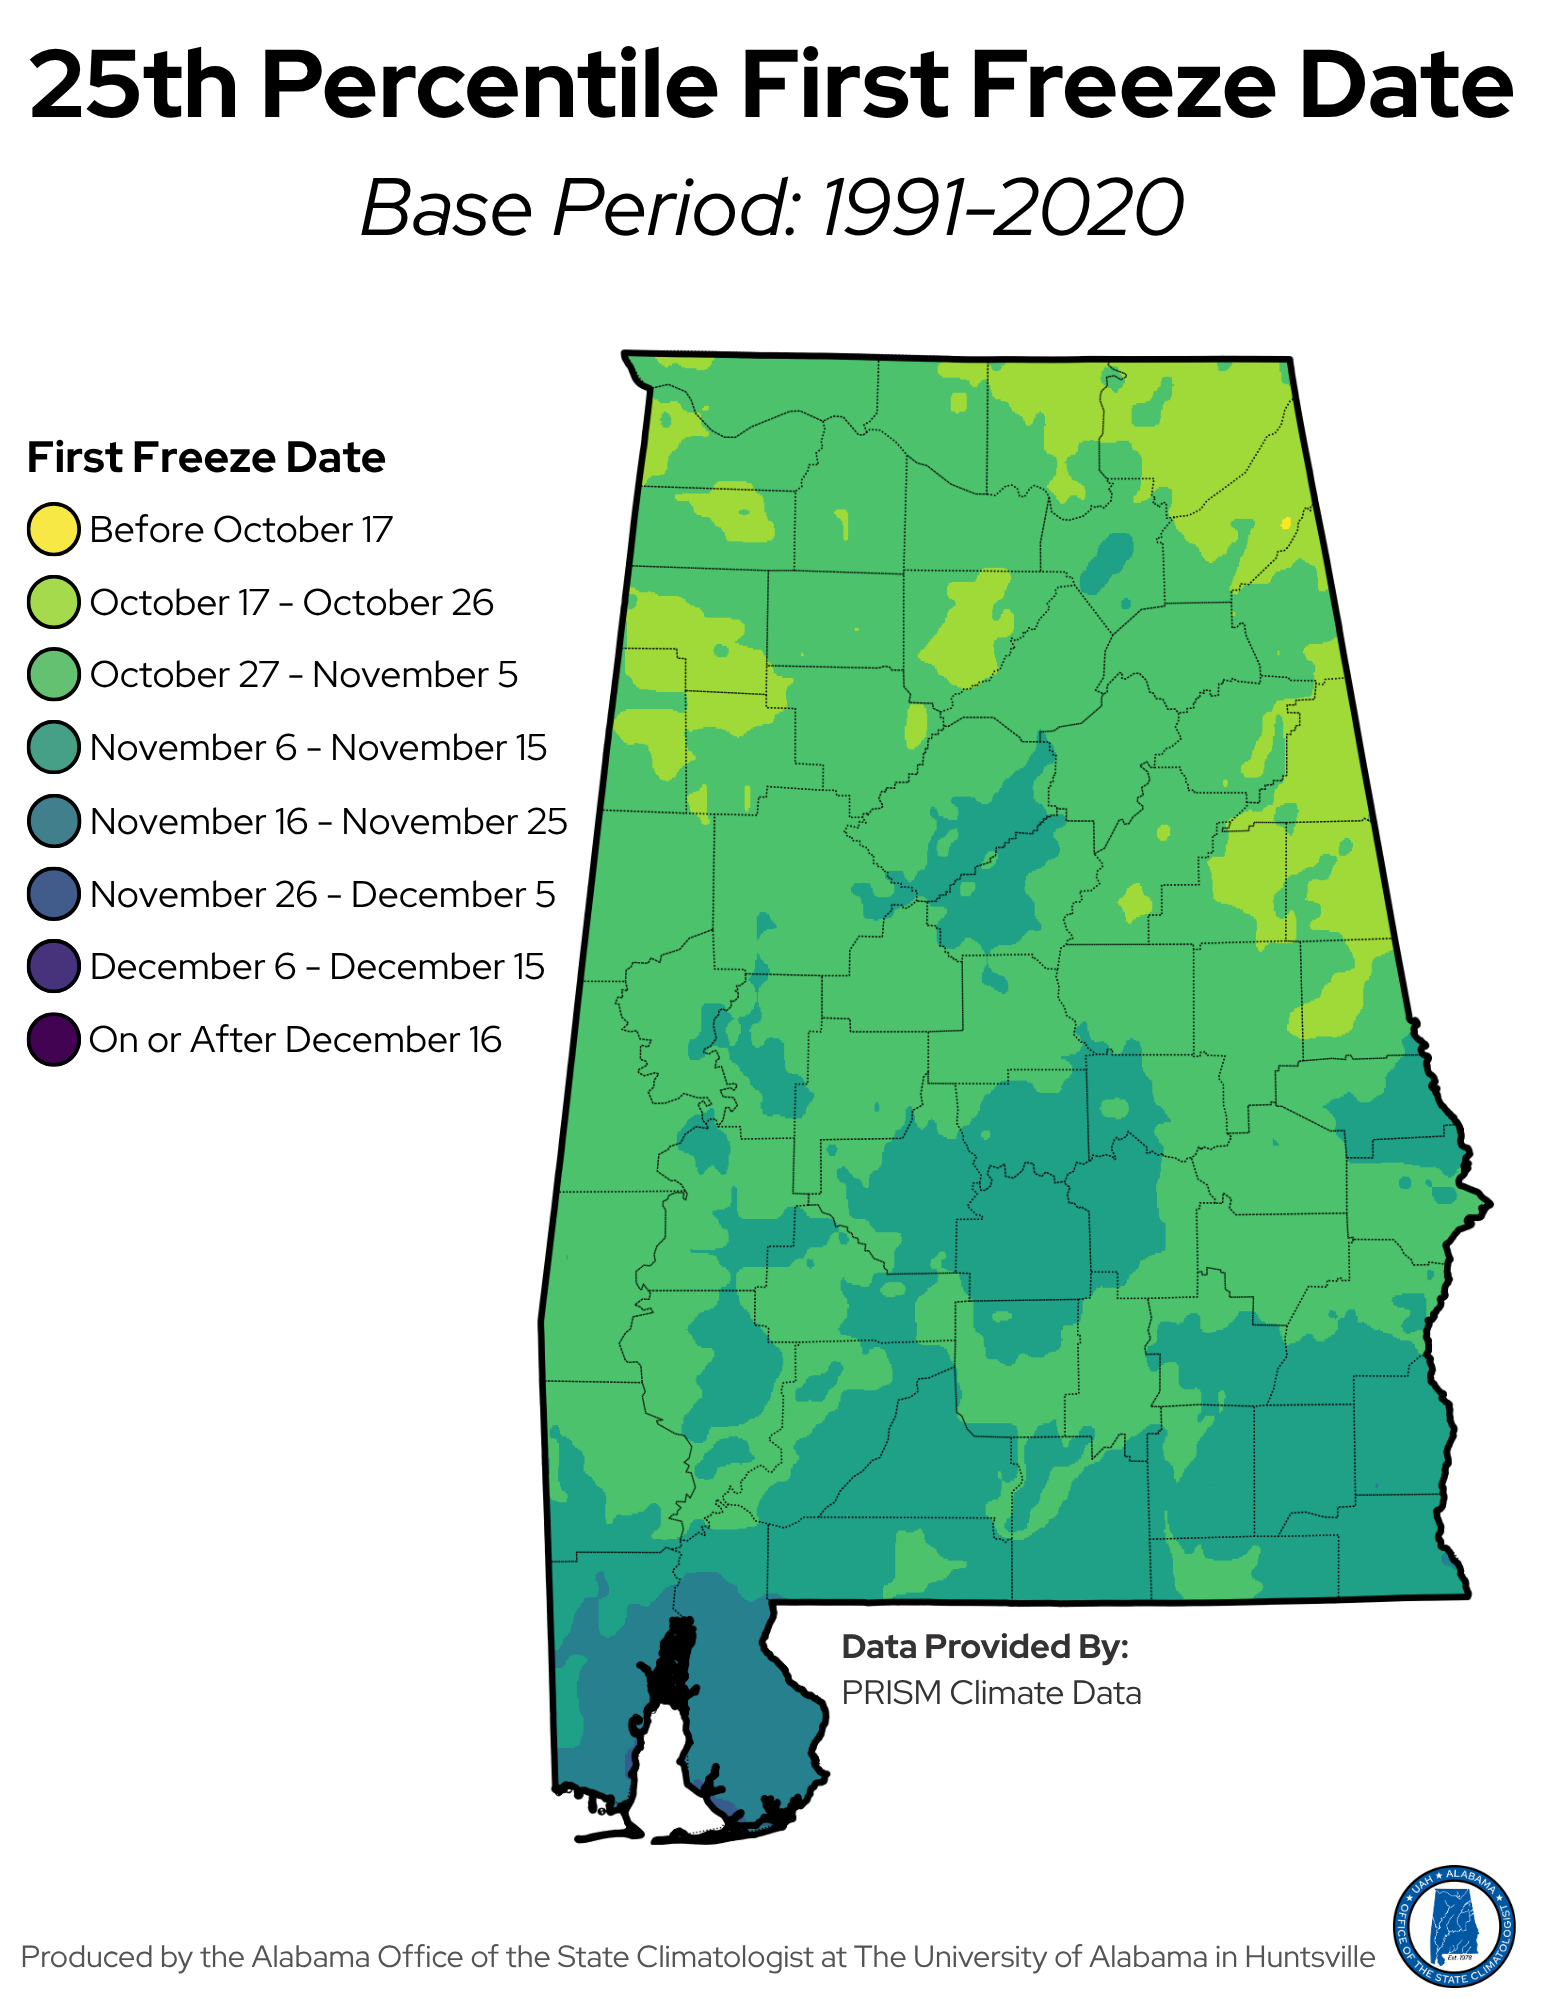
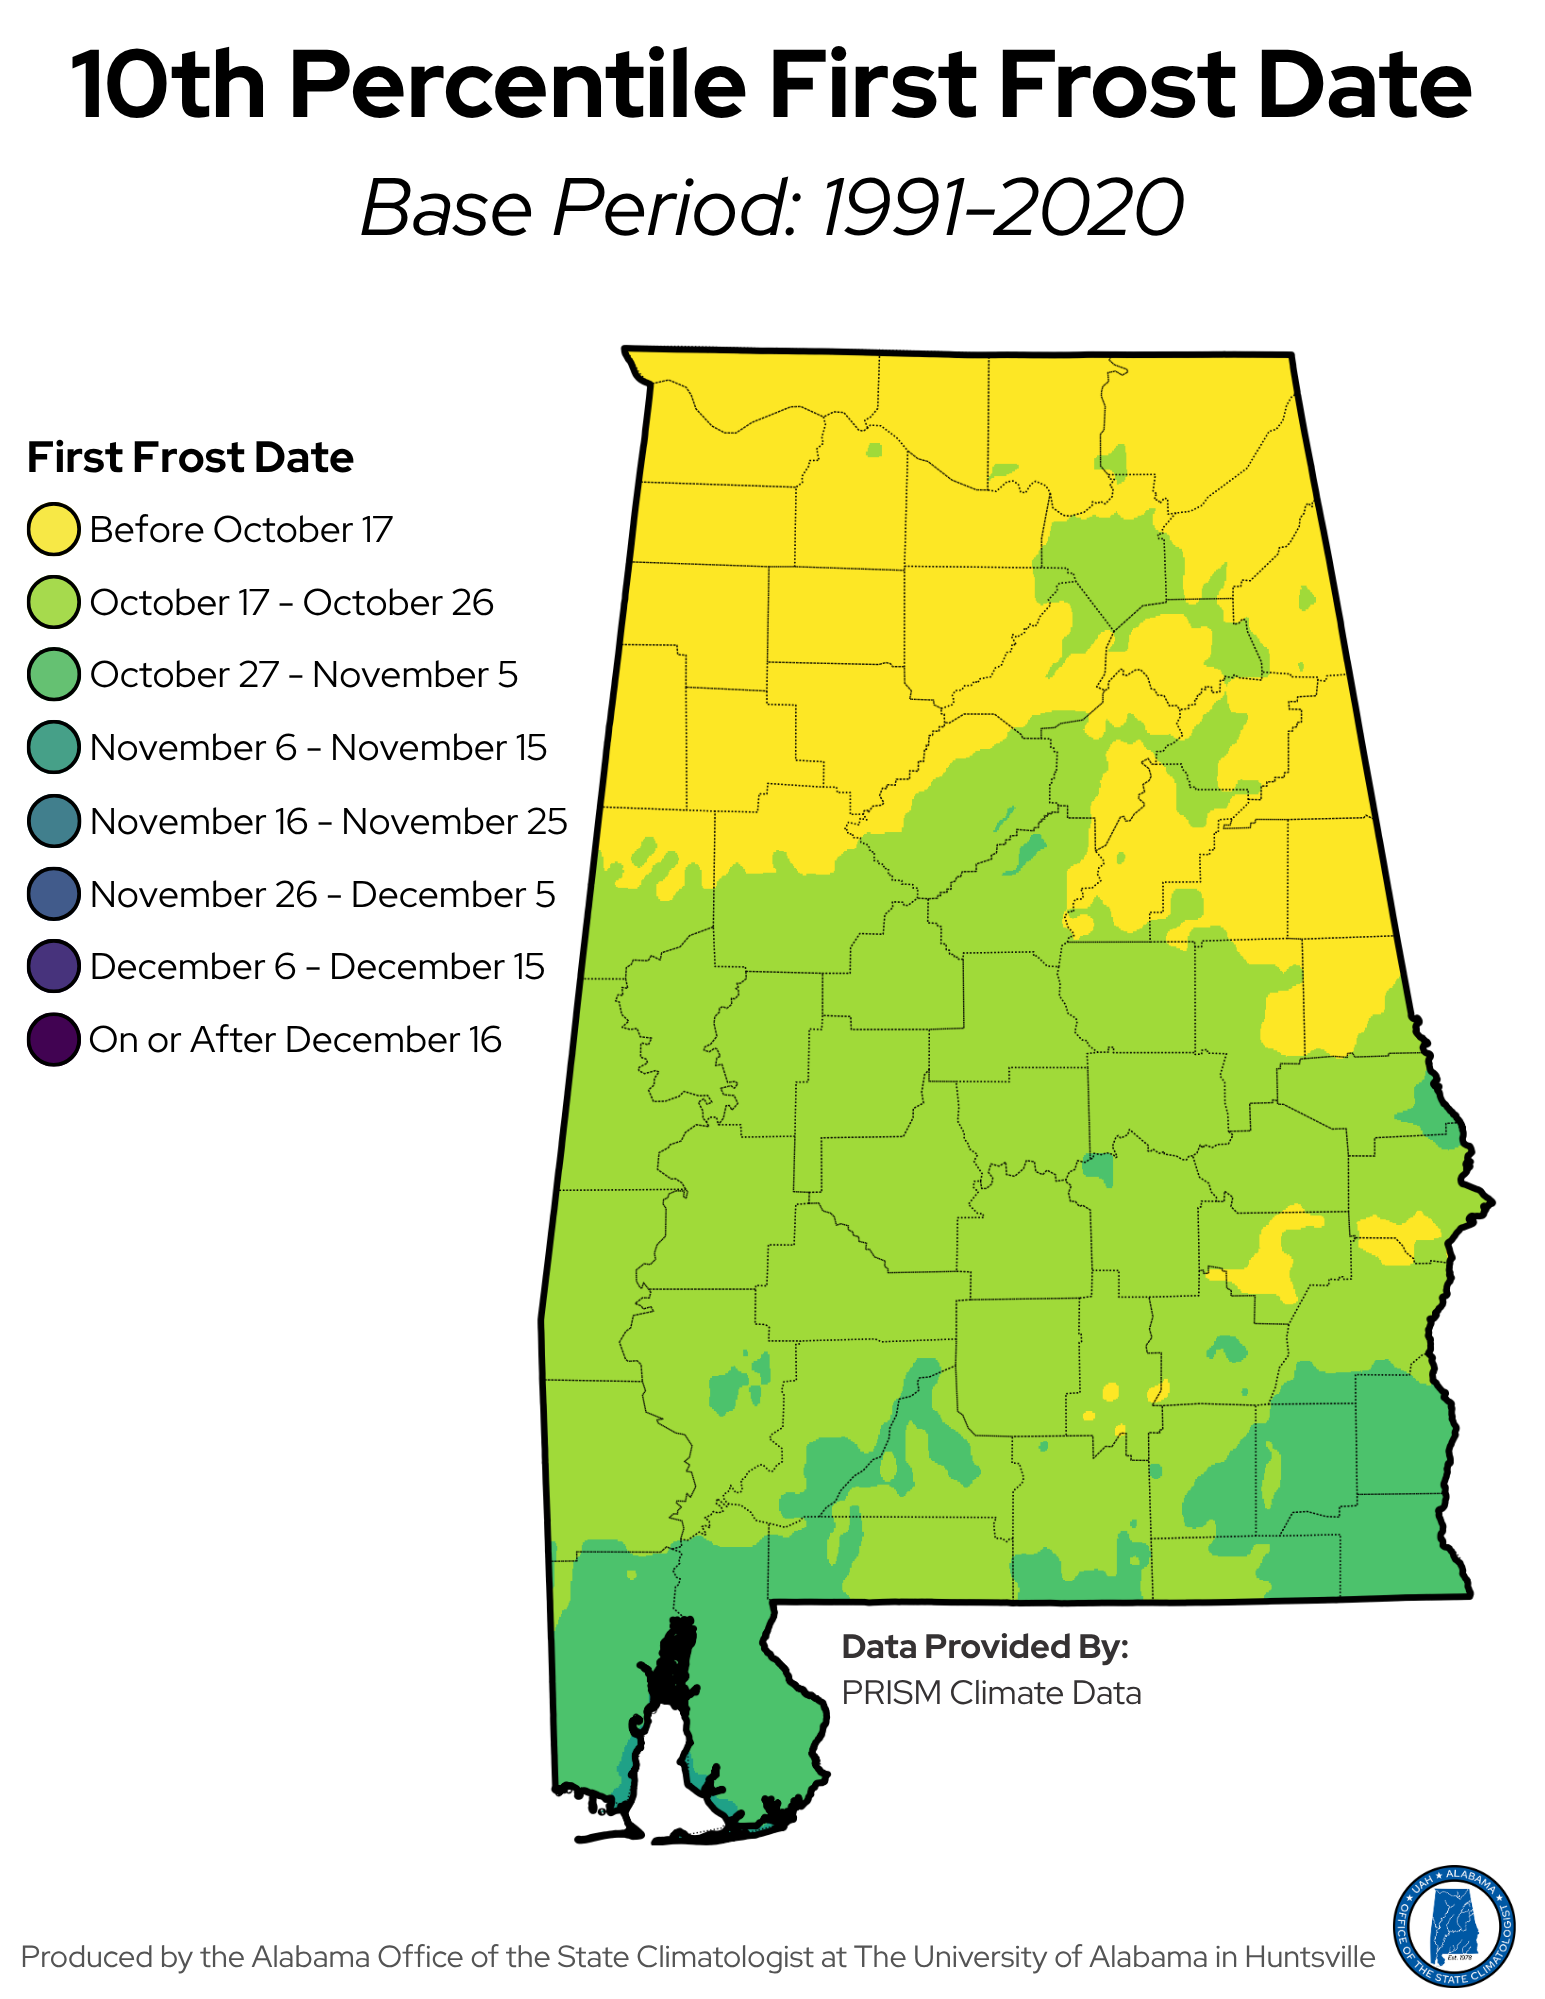
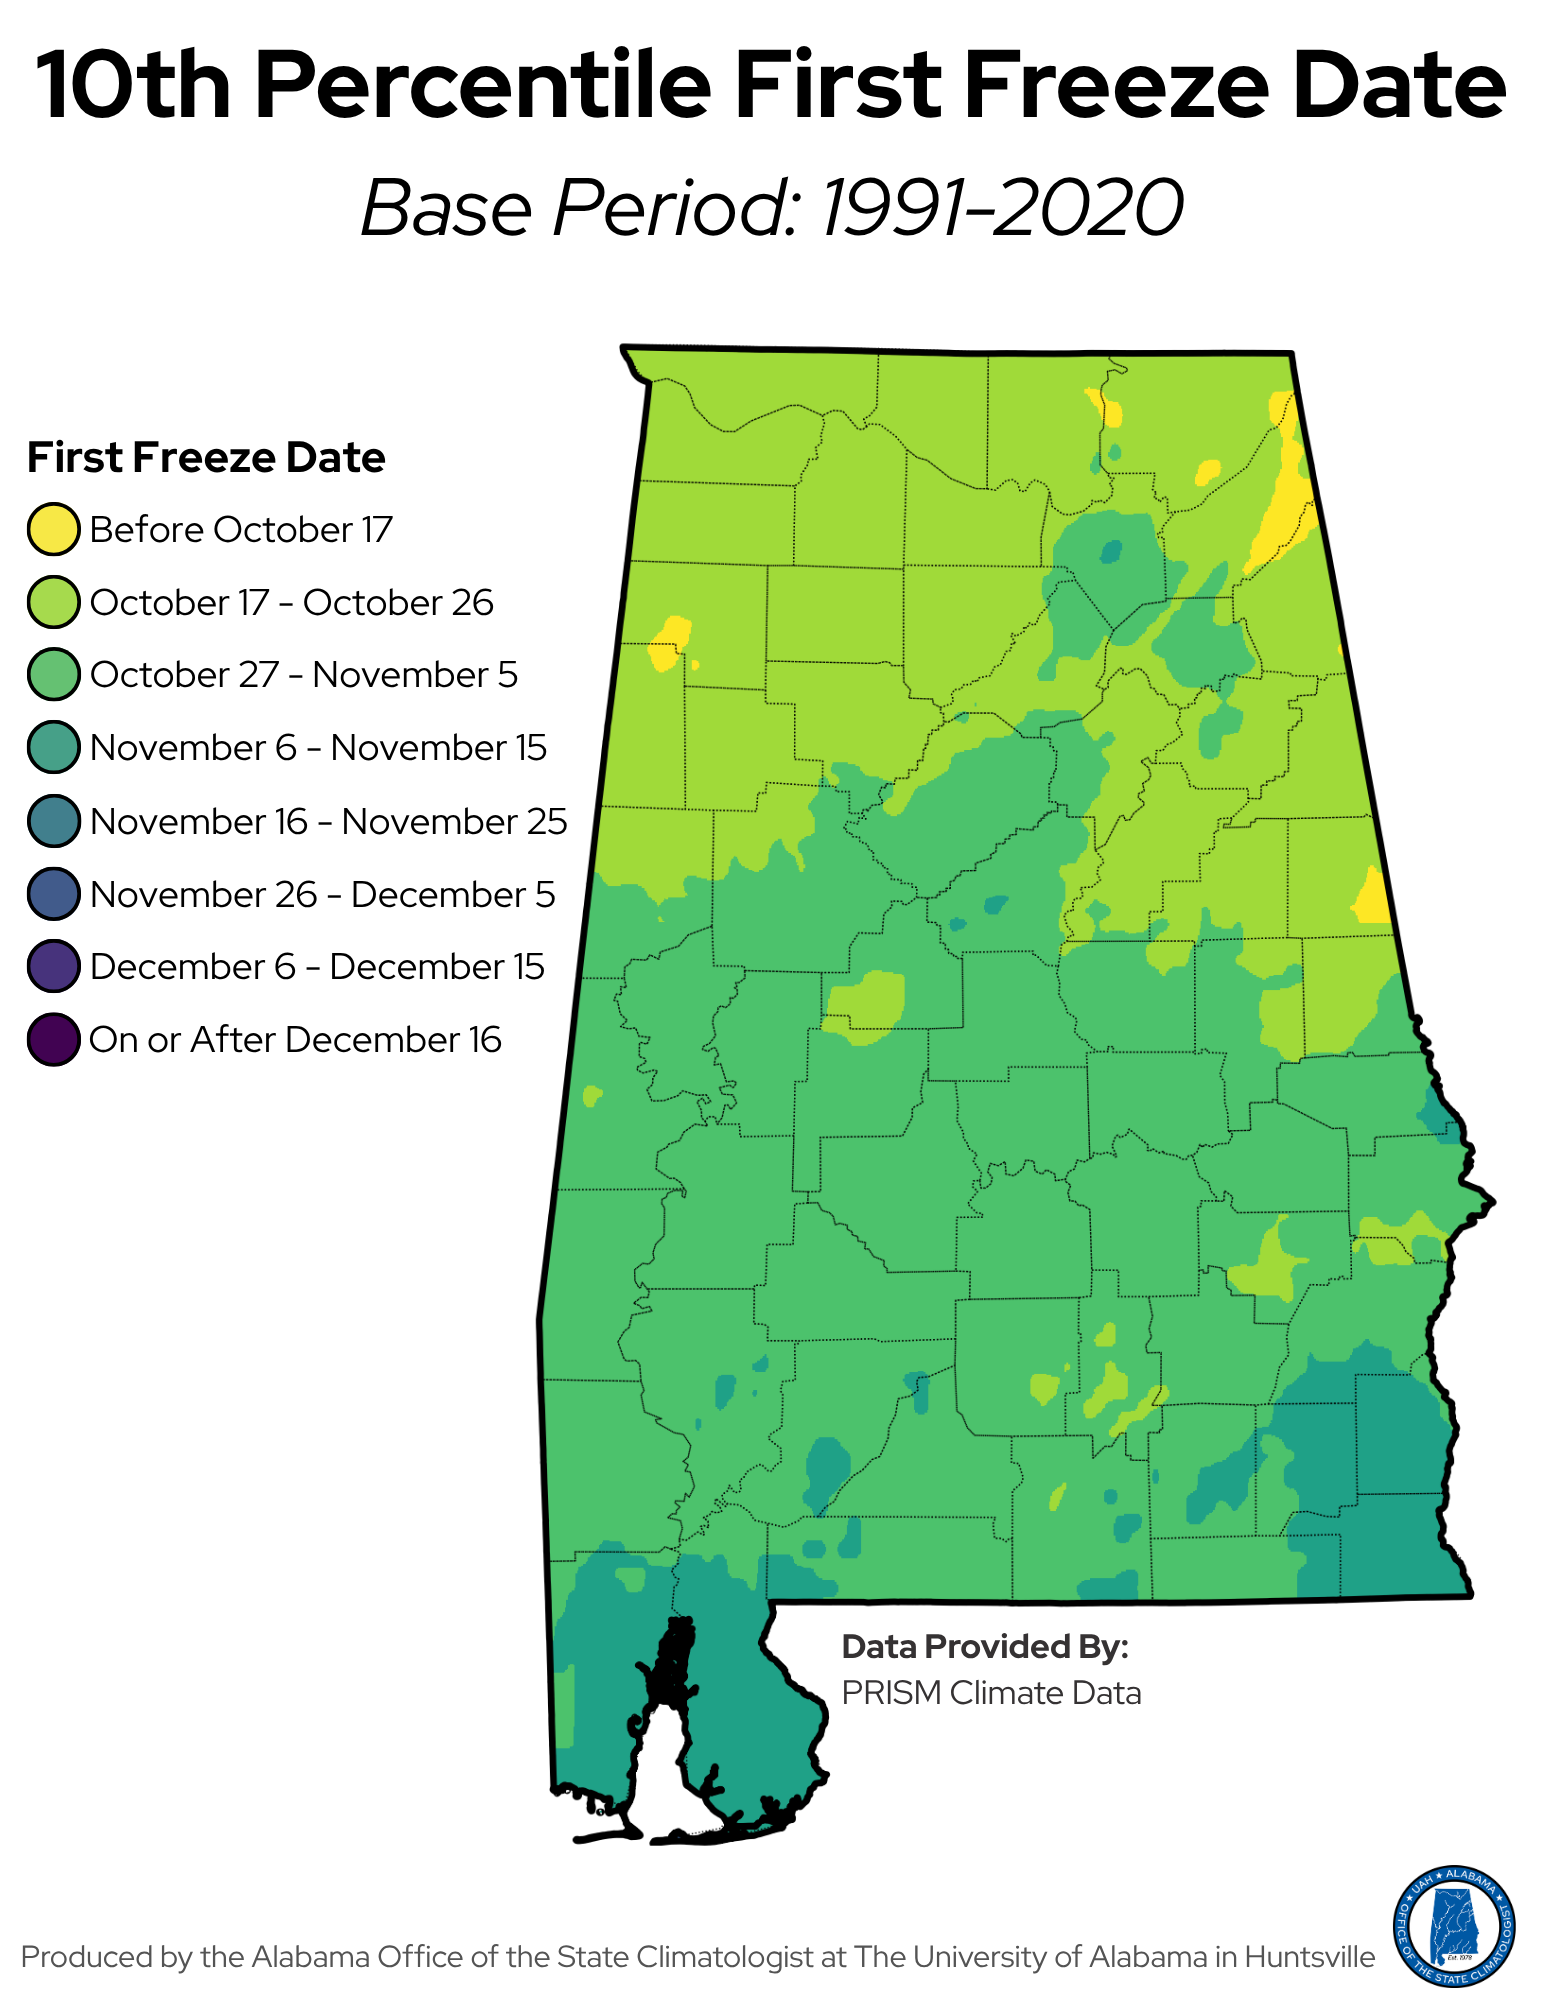
Figures 5–8 move beyond the average and help us think about the risk of an early frost or freeze. The average maps represent about a 50/50 chance that the first frost or freeze will occur before or after the date shown. If planning around an average feels too risky, the percentile maps can help you choose a more cautious date.
These maps illustrate the likelihood of an early-season frost or freeze. When compared to the average above, they help show how much the timing can change from year to year. The 25th and 10th percentile maps show dates when an unusually early frost or freeze may occur. The 25th percentile represents a date when a frost or freeze has historically occurred that early or earlier in about 1 out of 4 years (25%), while the 10th percentile represents a date when this has occurred in about 1 out of 10 years (10%). These percentiles help illustrate the range of possible frost and freeze dates, allowing farmers, gardeners, and other decision-makers to better understand the risk of early cold events and plan accordingly.
These maps can be especially useful for producers and home gardeners planning fall harvests or winter crops. Simply find your location on the map, choose the frost or freeze date you want to plan around, and count backward the number of days your crop needs to mature. This can help you decide when to plant so your crop has enough time to grow and be harvested before frost or freezing temperatures arrive.
How Early or Late Can the First Frost or Freeze Occur?
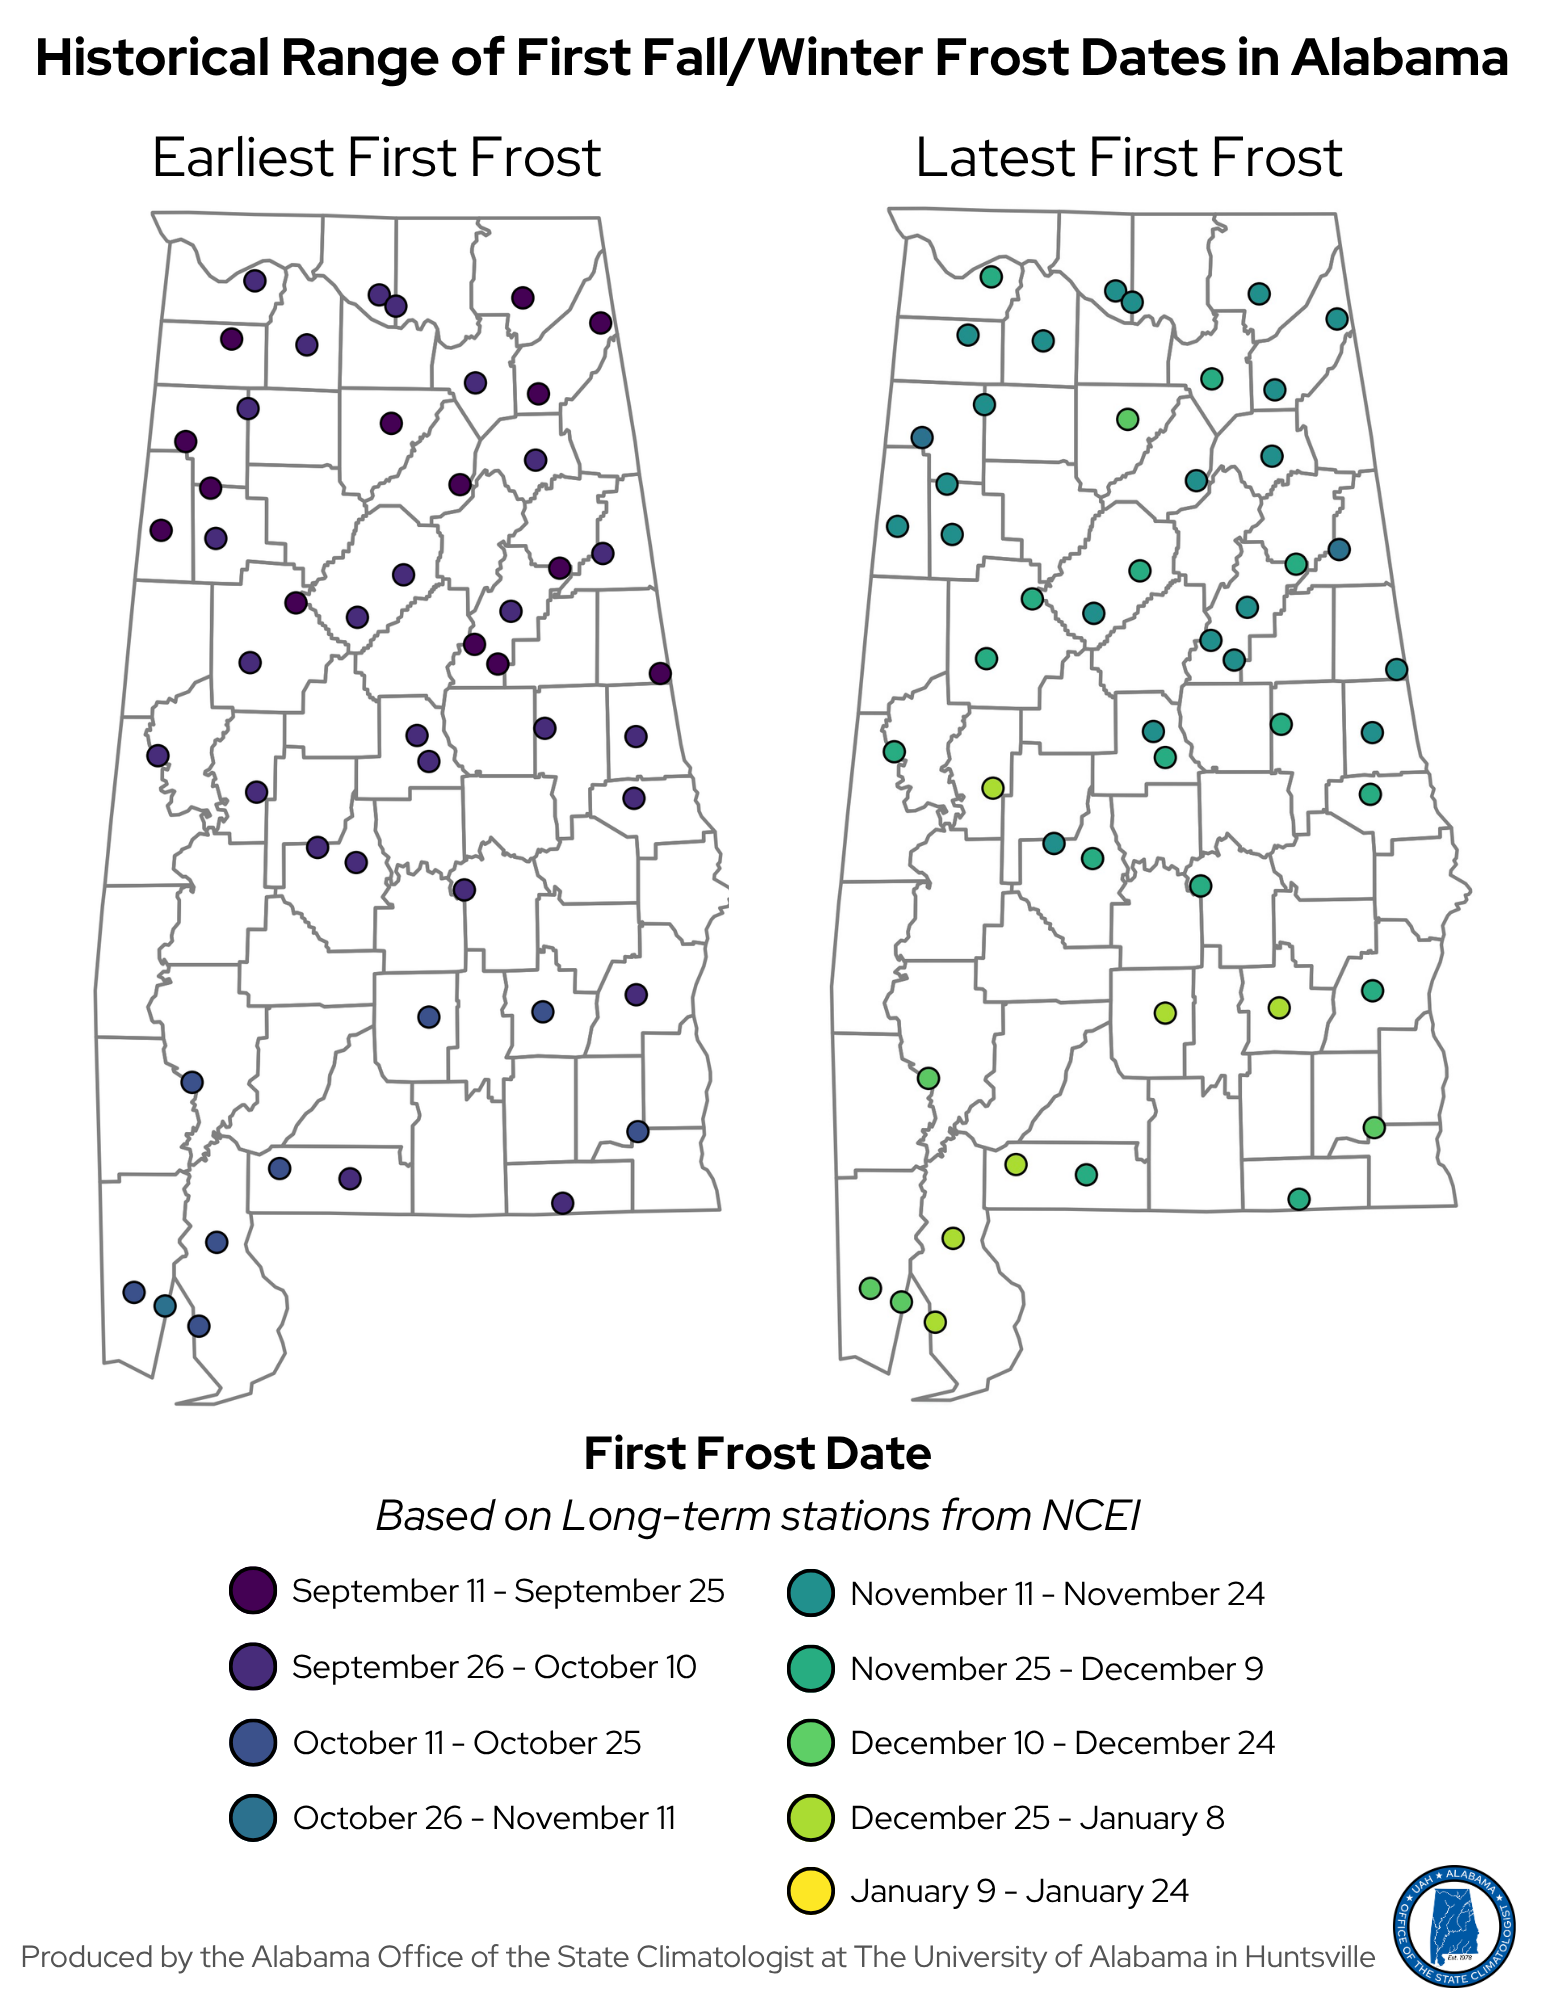
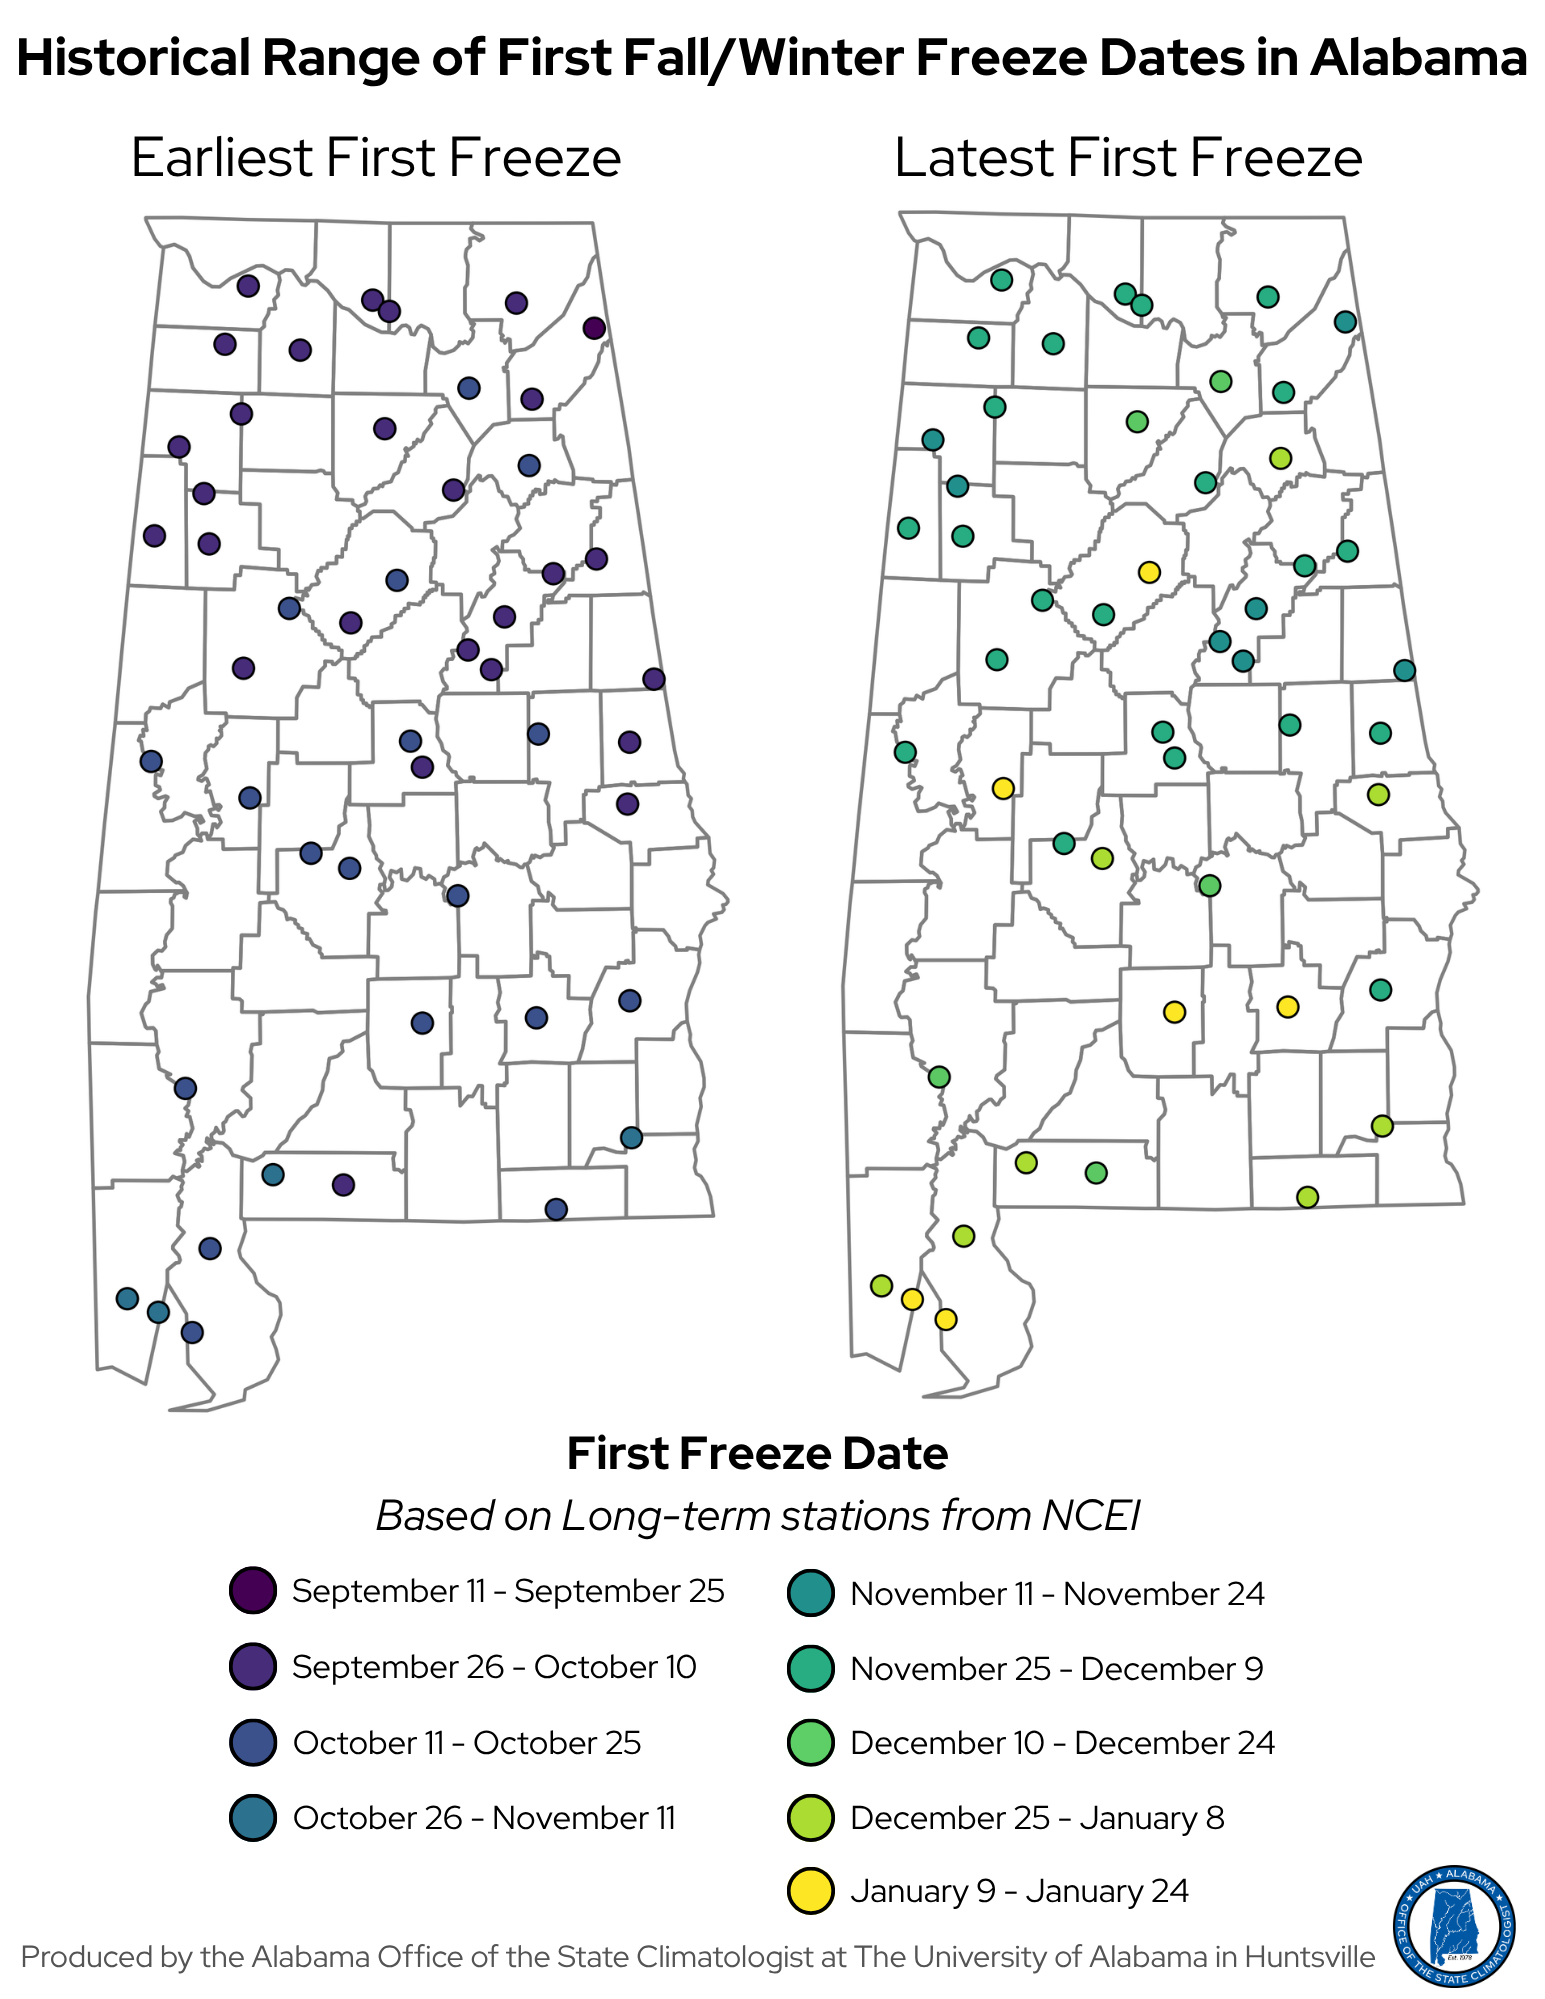
While averages and percentiles help us understand typical conditions and the risk of an early frost or freeze, historical station records show just how early or late the first frost and freeze can occur across Alabama. The earliest first frost occurred on September 16 in Valley Head in 1940, while the latest occurred on January 3, recorded in Bay Minette in 1919 and in Greensboro, Greenville, and Troy in 1932. First freeze dates show a similarly wide range. Valley Head recorded its first freeze as early as September 22 in 1983, while the latest occurred on January 21 at Mobile Downtown Airport in 2019.
It is important to remember that these extremes were recorded at individual weather stations and do not represent statewide conditions in those years. They do, however, highlight how much the timing of the first frost and freeze can vary from one location to another. Northern and higher-elevation areas generally experience their first frost and freeze earlier, while southern Alabama can remain frost- and freeze-free much longer. You can view Figures 9 and 10 and Table 1 for first frost and freeze dates specific to your area. If you have further questions, you can reach out to us at aosc@uah.edu.
How Are These Dates Changing?
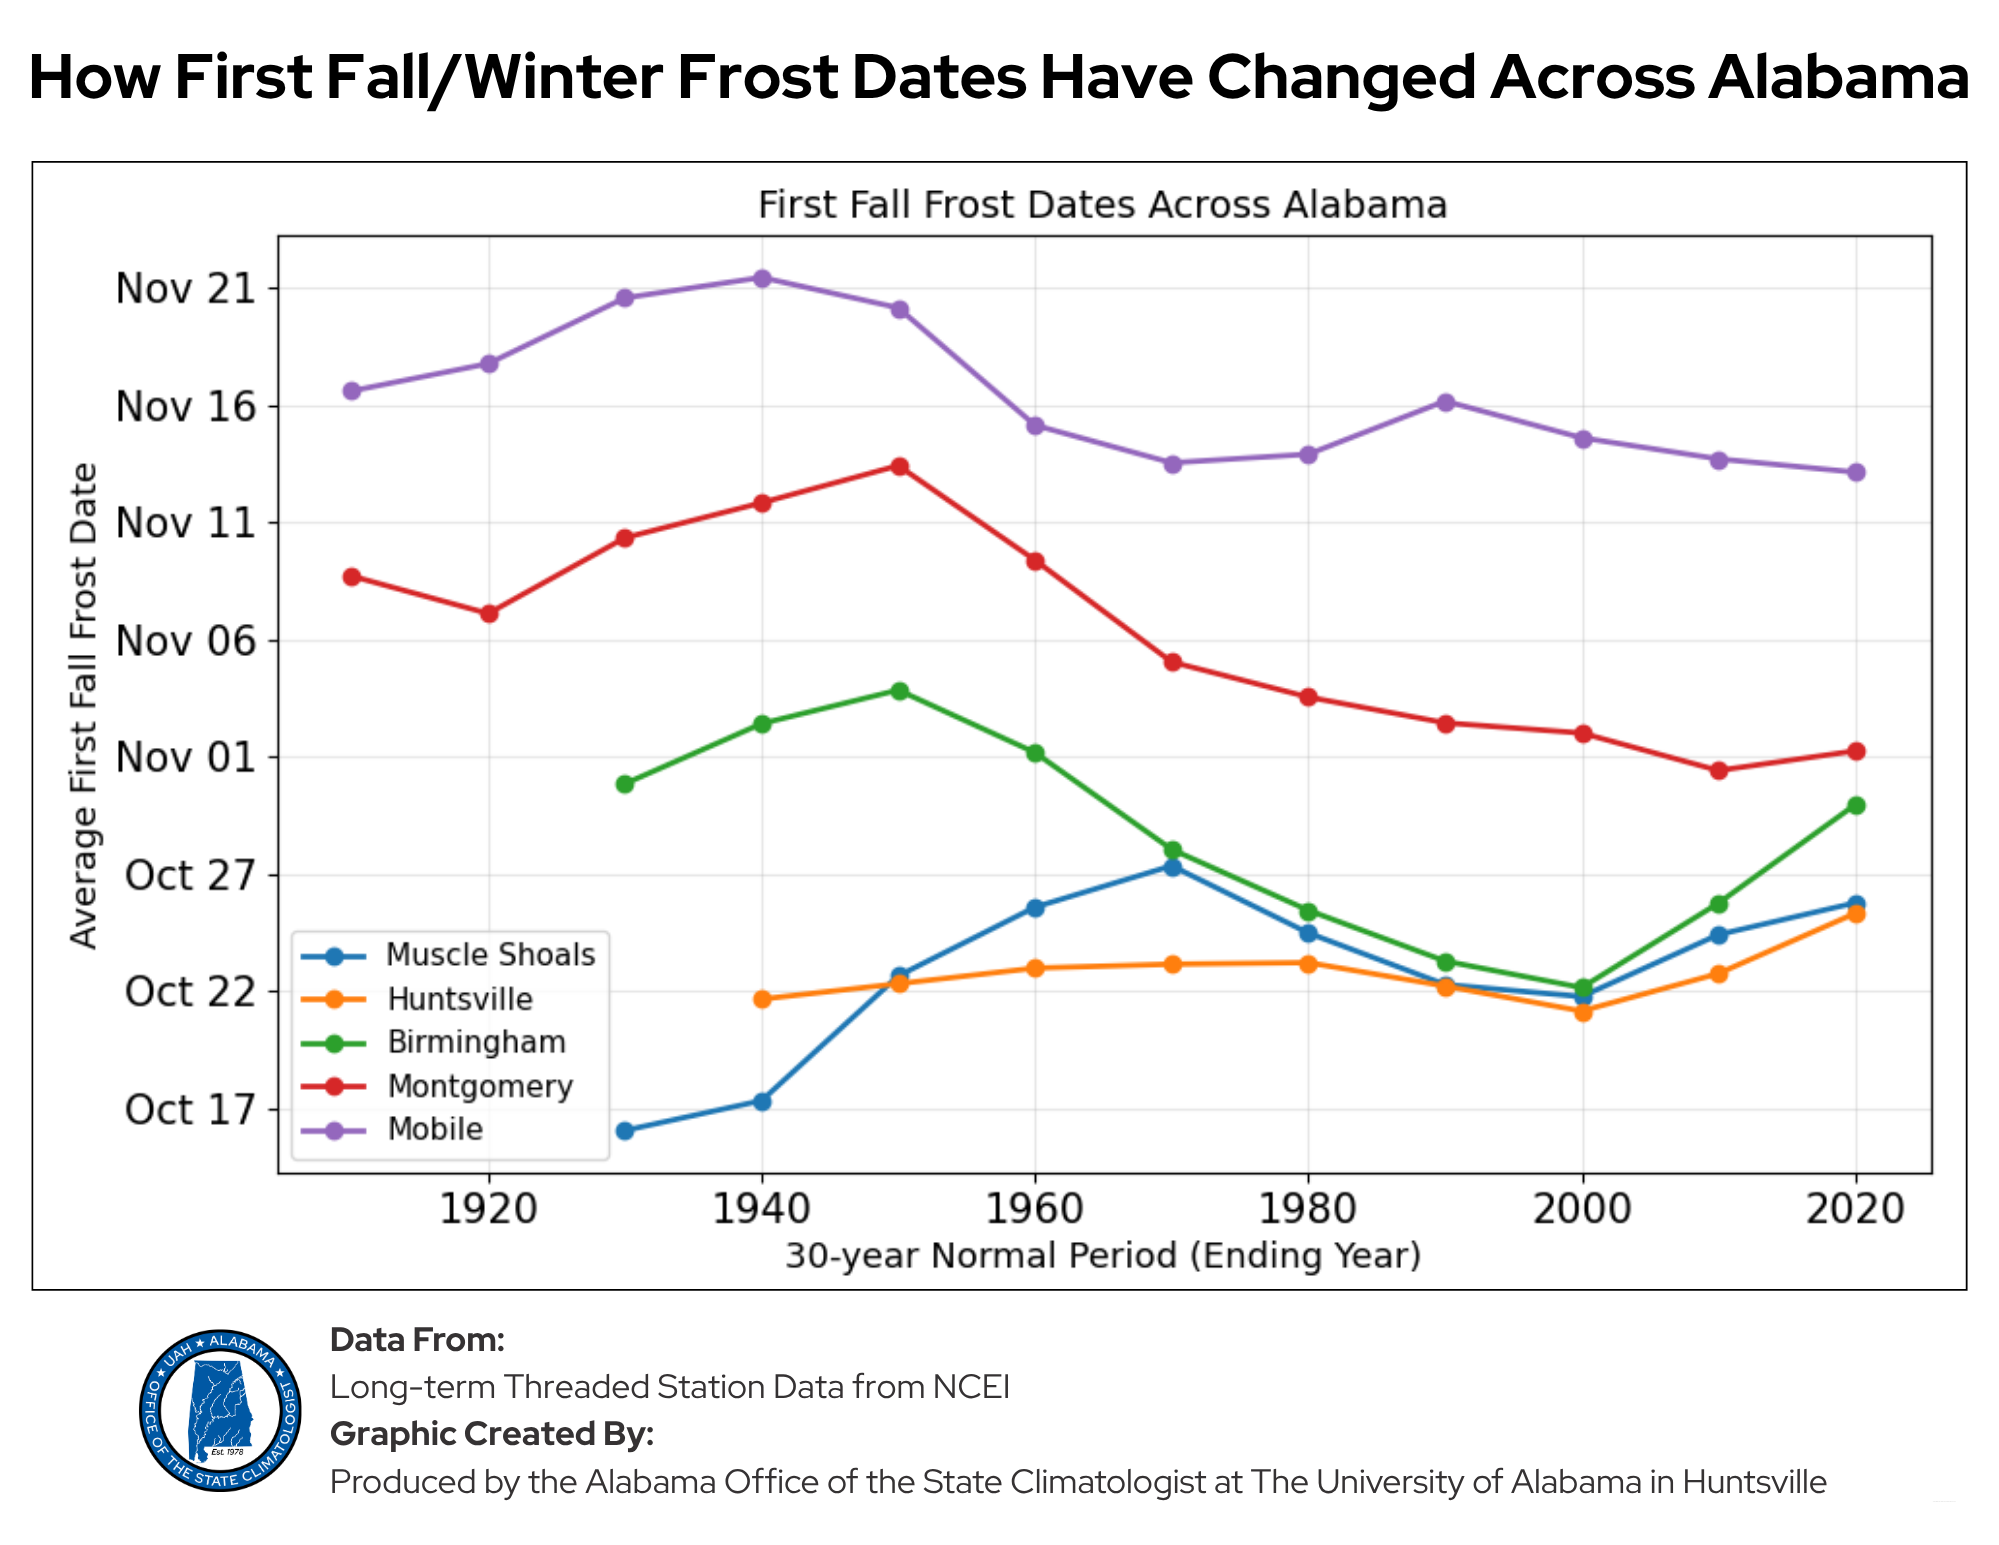
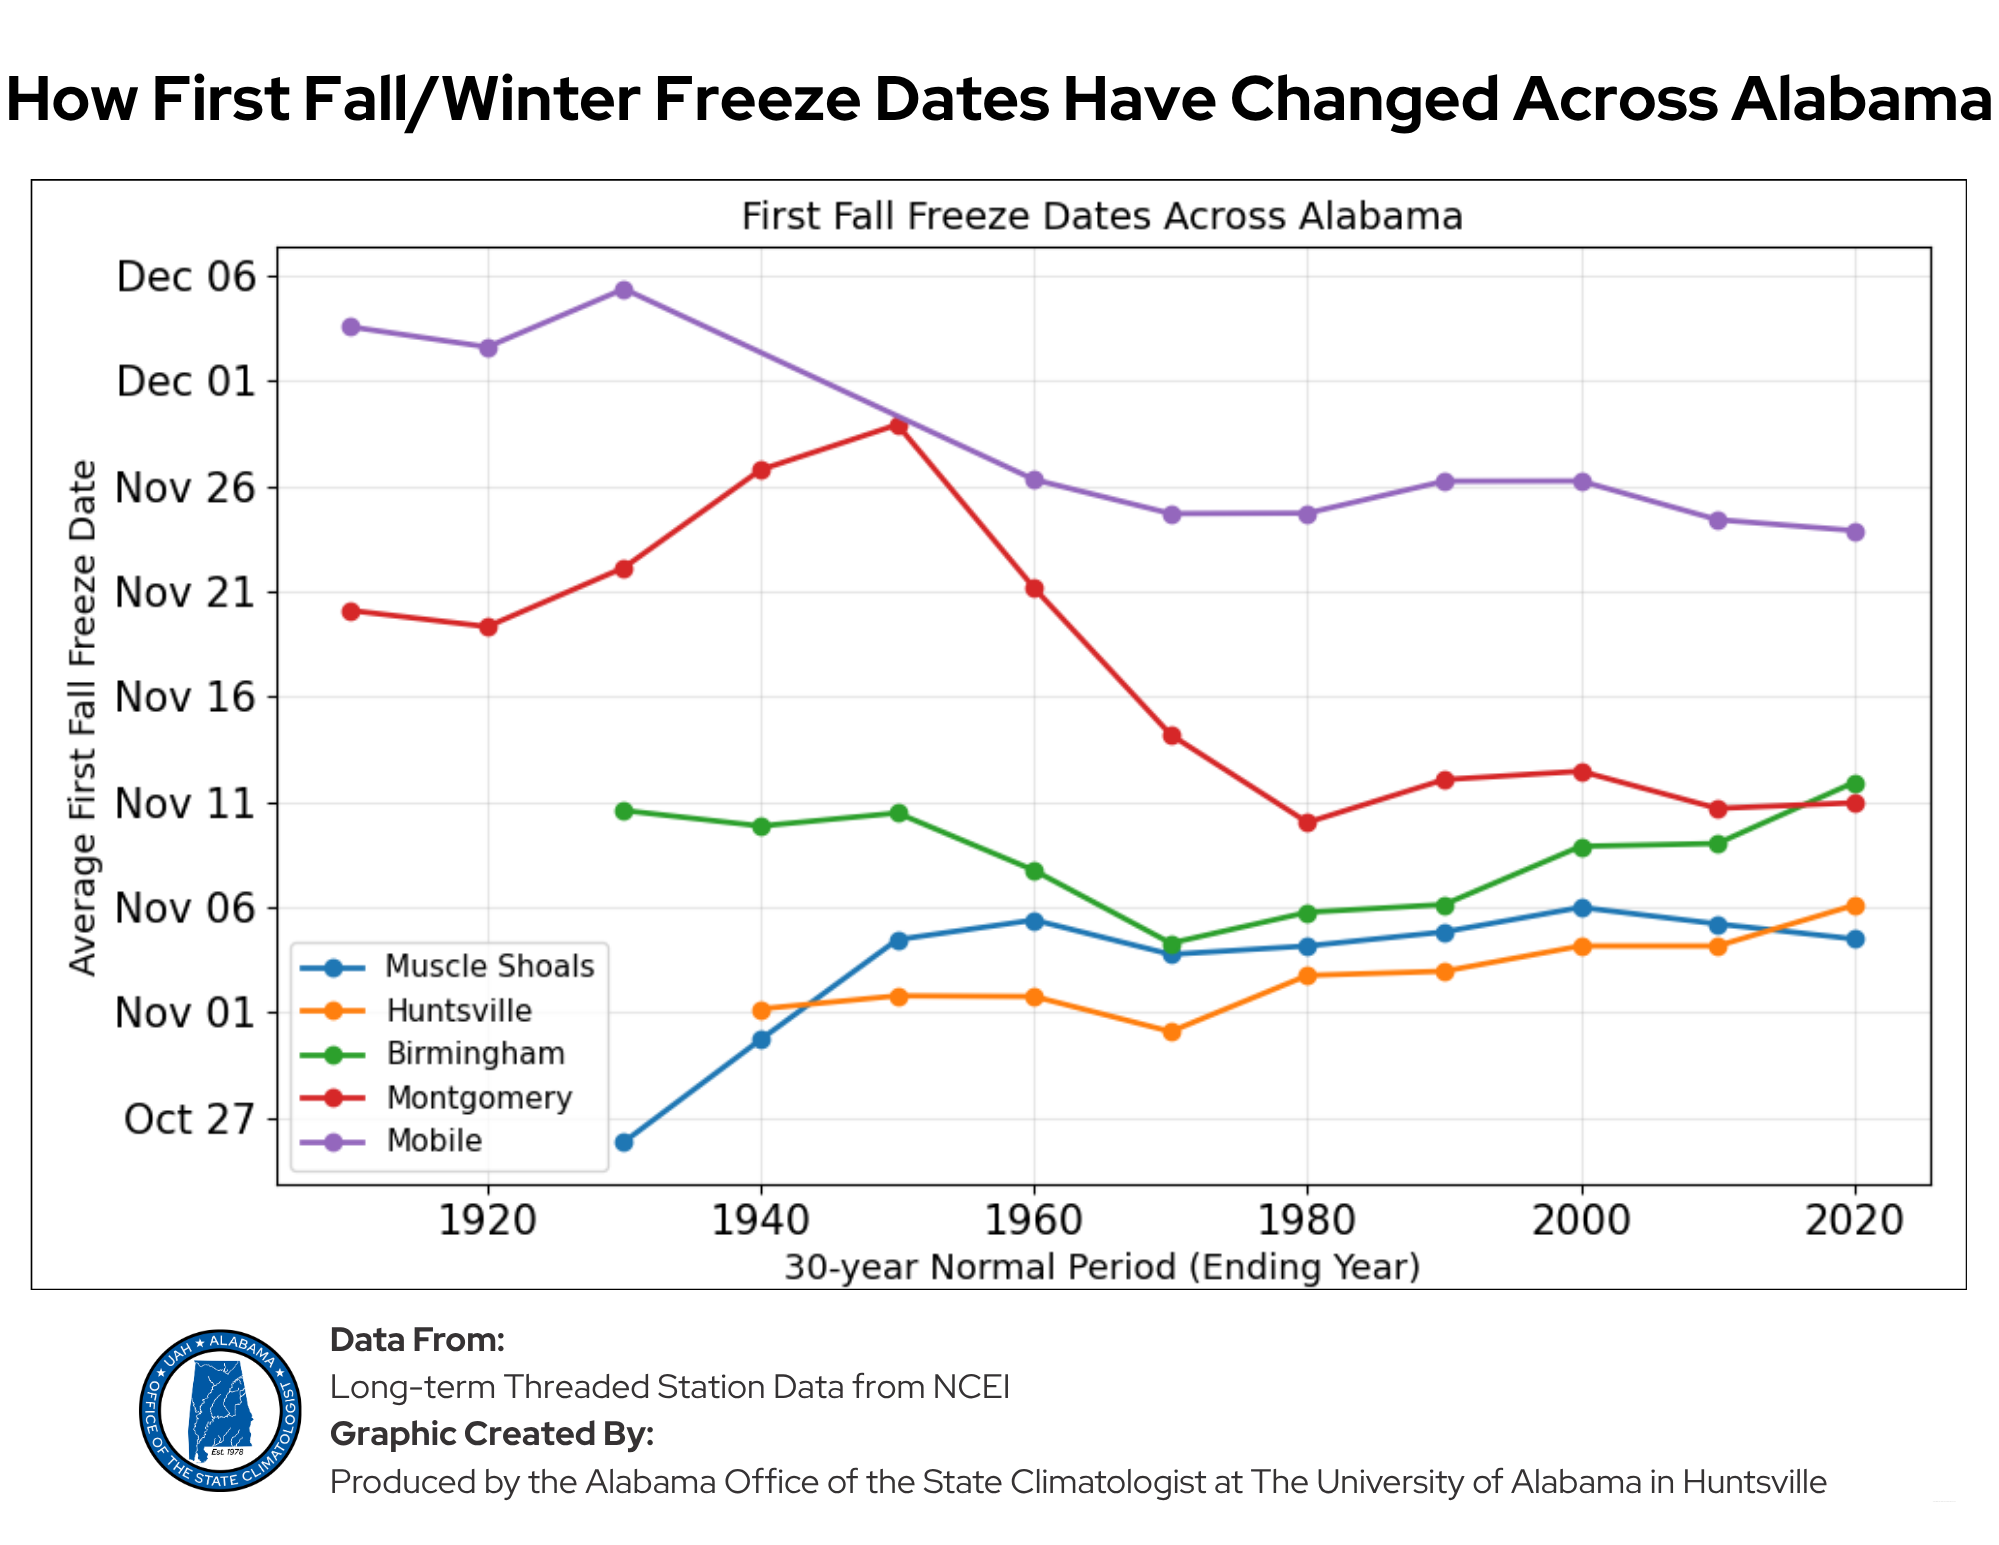
To see whether first frost and first freeze dates are shifting over time, we also compared long-term records for five representative cities: Huntsville and Muscle Shoals in North Alabama, Birmingham and Montgomery in Central Alabama, and Mobile in South Alabama. Figures 11 and 12 show the average first frost and first freeze dates for consecutive Climate Normals (30-year periods) from 1893 (1897 for Birmingham, 1908 for Huntsville) until 2020*.
The patterns are not the same everywhere. In North Alabama, both first frost and first freeze dates have generally shifted slightly later over the past century. Huntsville and Muscle Shoals show some of the clearest changes, with first frost and freeze dates occurring 5 -10 days later in the most recent Climate Normals than they did in the earliest periods of record. Montgomery and Mobile show the opposite with frosts and freezes occurring 5 -10 earlier on average.
Looking at the most recent 30-year Normal (1991–2020), all five cities have experienced some change in their average first frost and freeze dates compared with earlier periods, although the direction and amount of change vary by location. These differences highlight why local climate records are important when planning around the timing of the first frost and freeze in Alabama.
Even with these shifts, one thing remains clear: year-to-year variability is significant. At every location, first frost and first freeze dates can vary considerably from one year to the next. Figures 13 and 14 show that the range of first frost and freeze dates can span two months or more at some locations. Some falls see frost and freezing temperatures arrive relatively early, while others remain warm enough well into November or even December. A trend toward earlier or later average dates does not eliminate the possibility of an unusually early or late first frost or freeze in any given year.
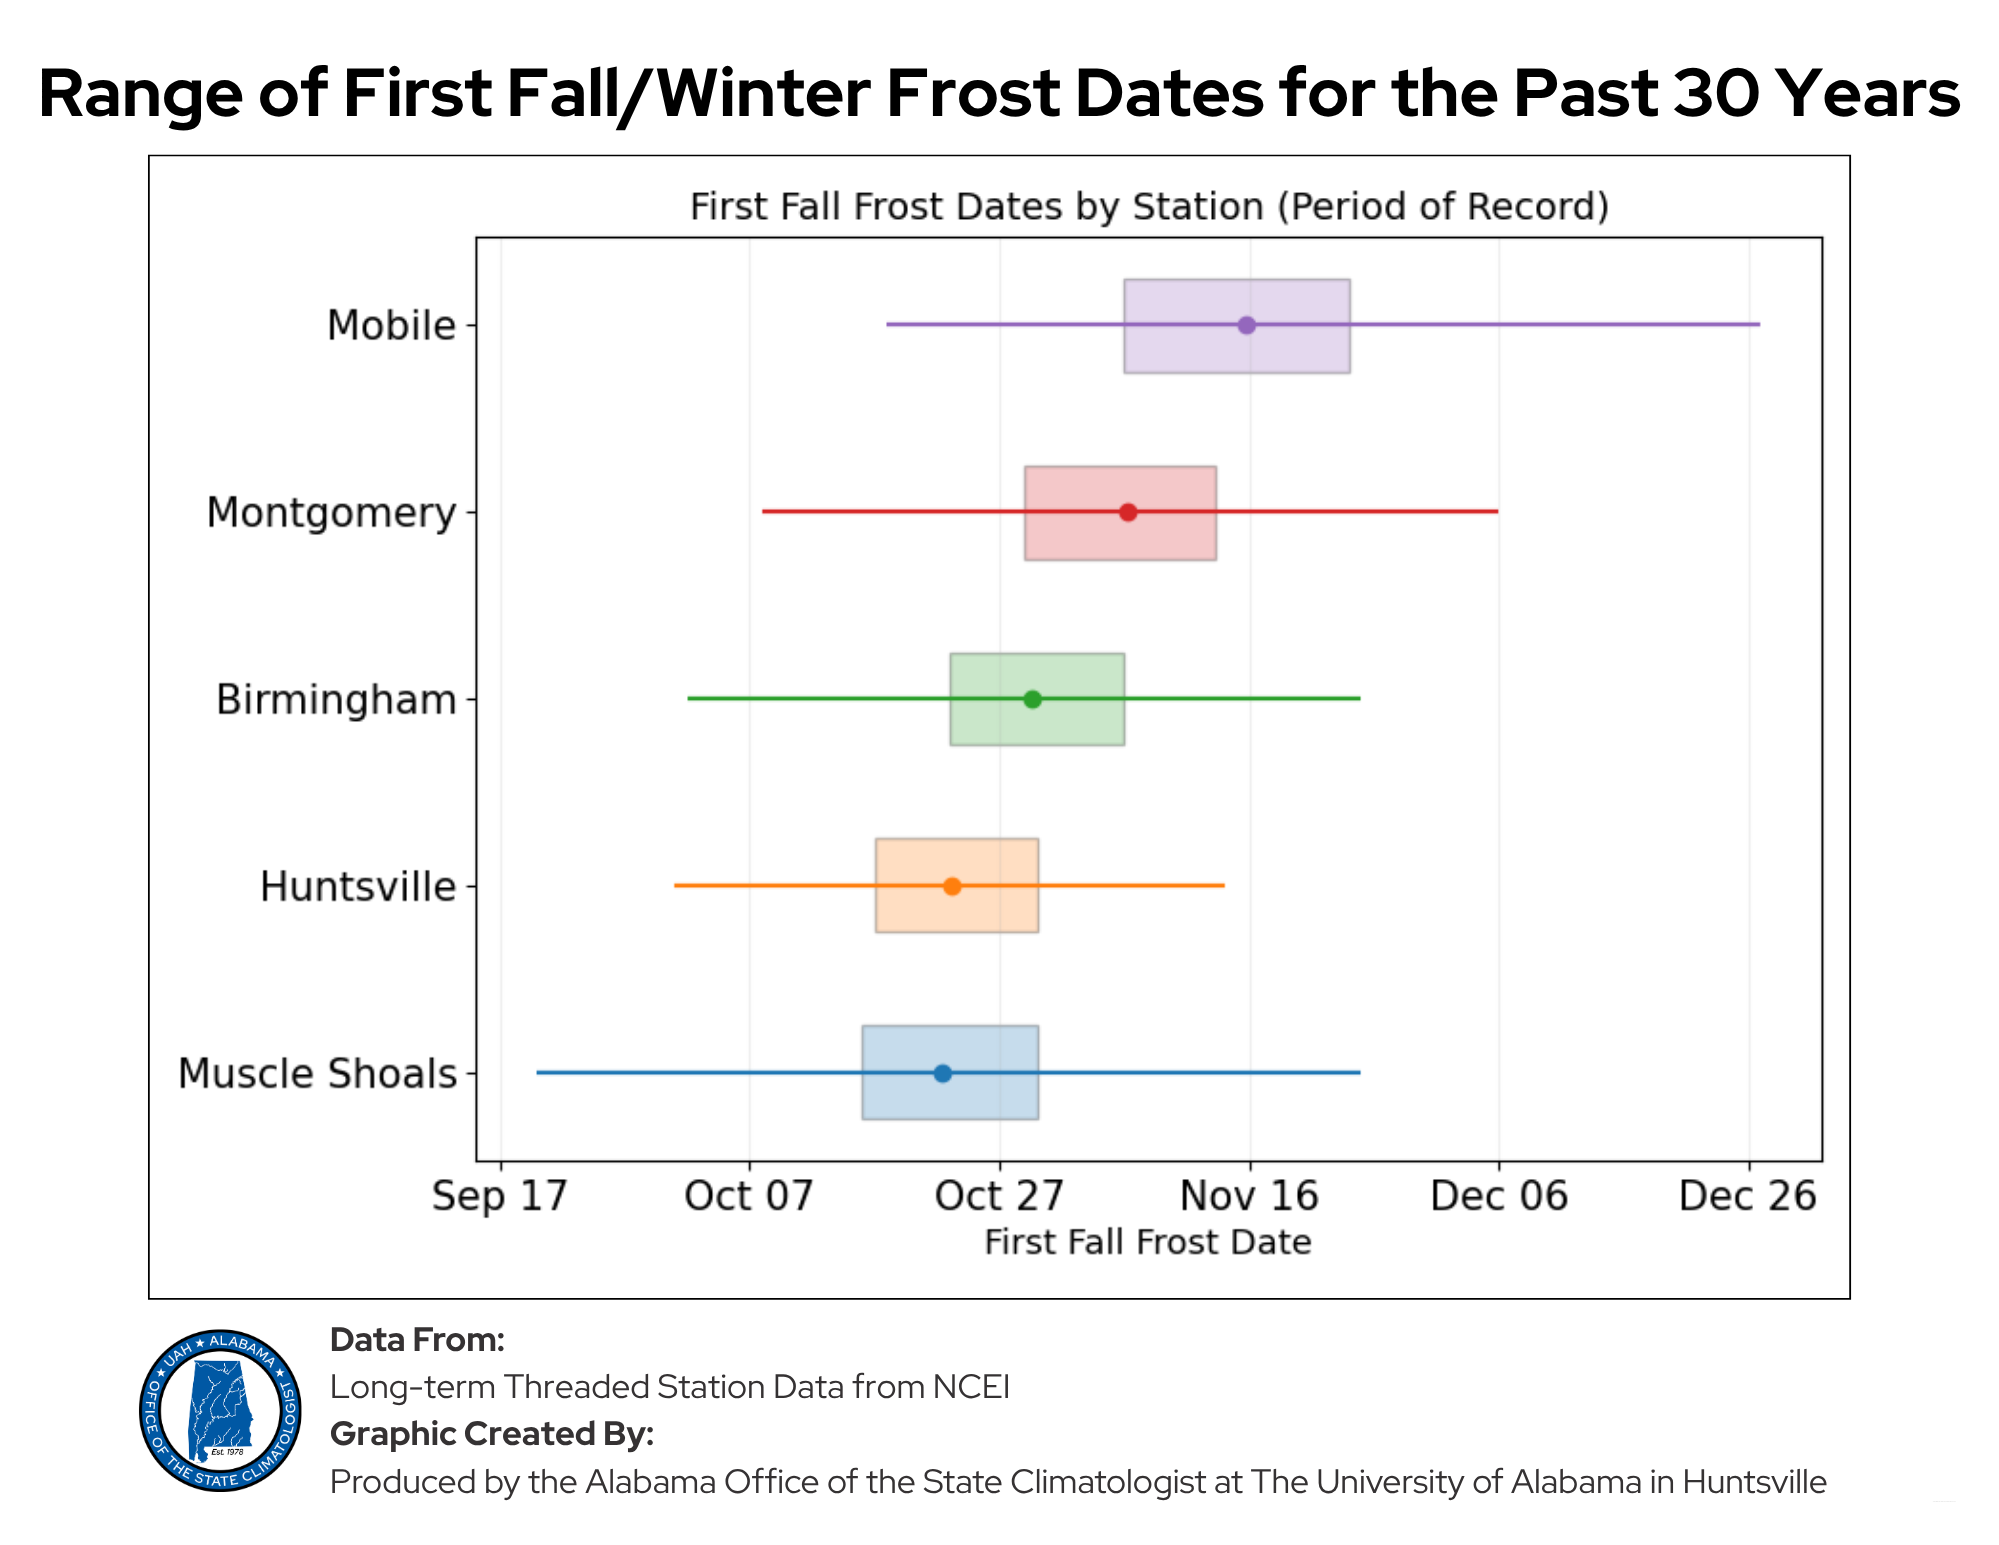
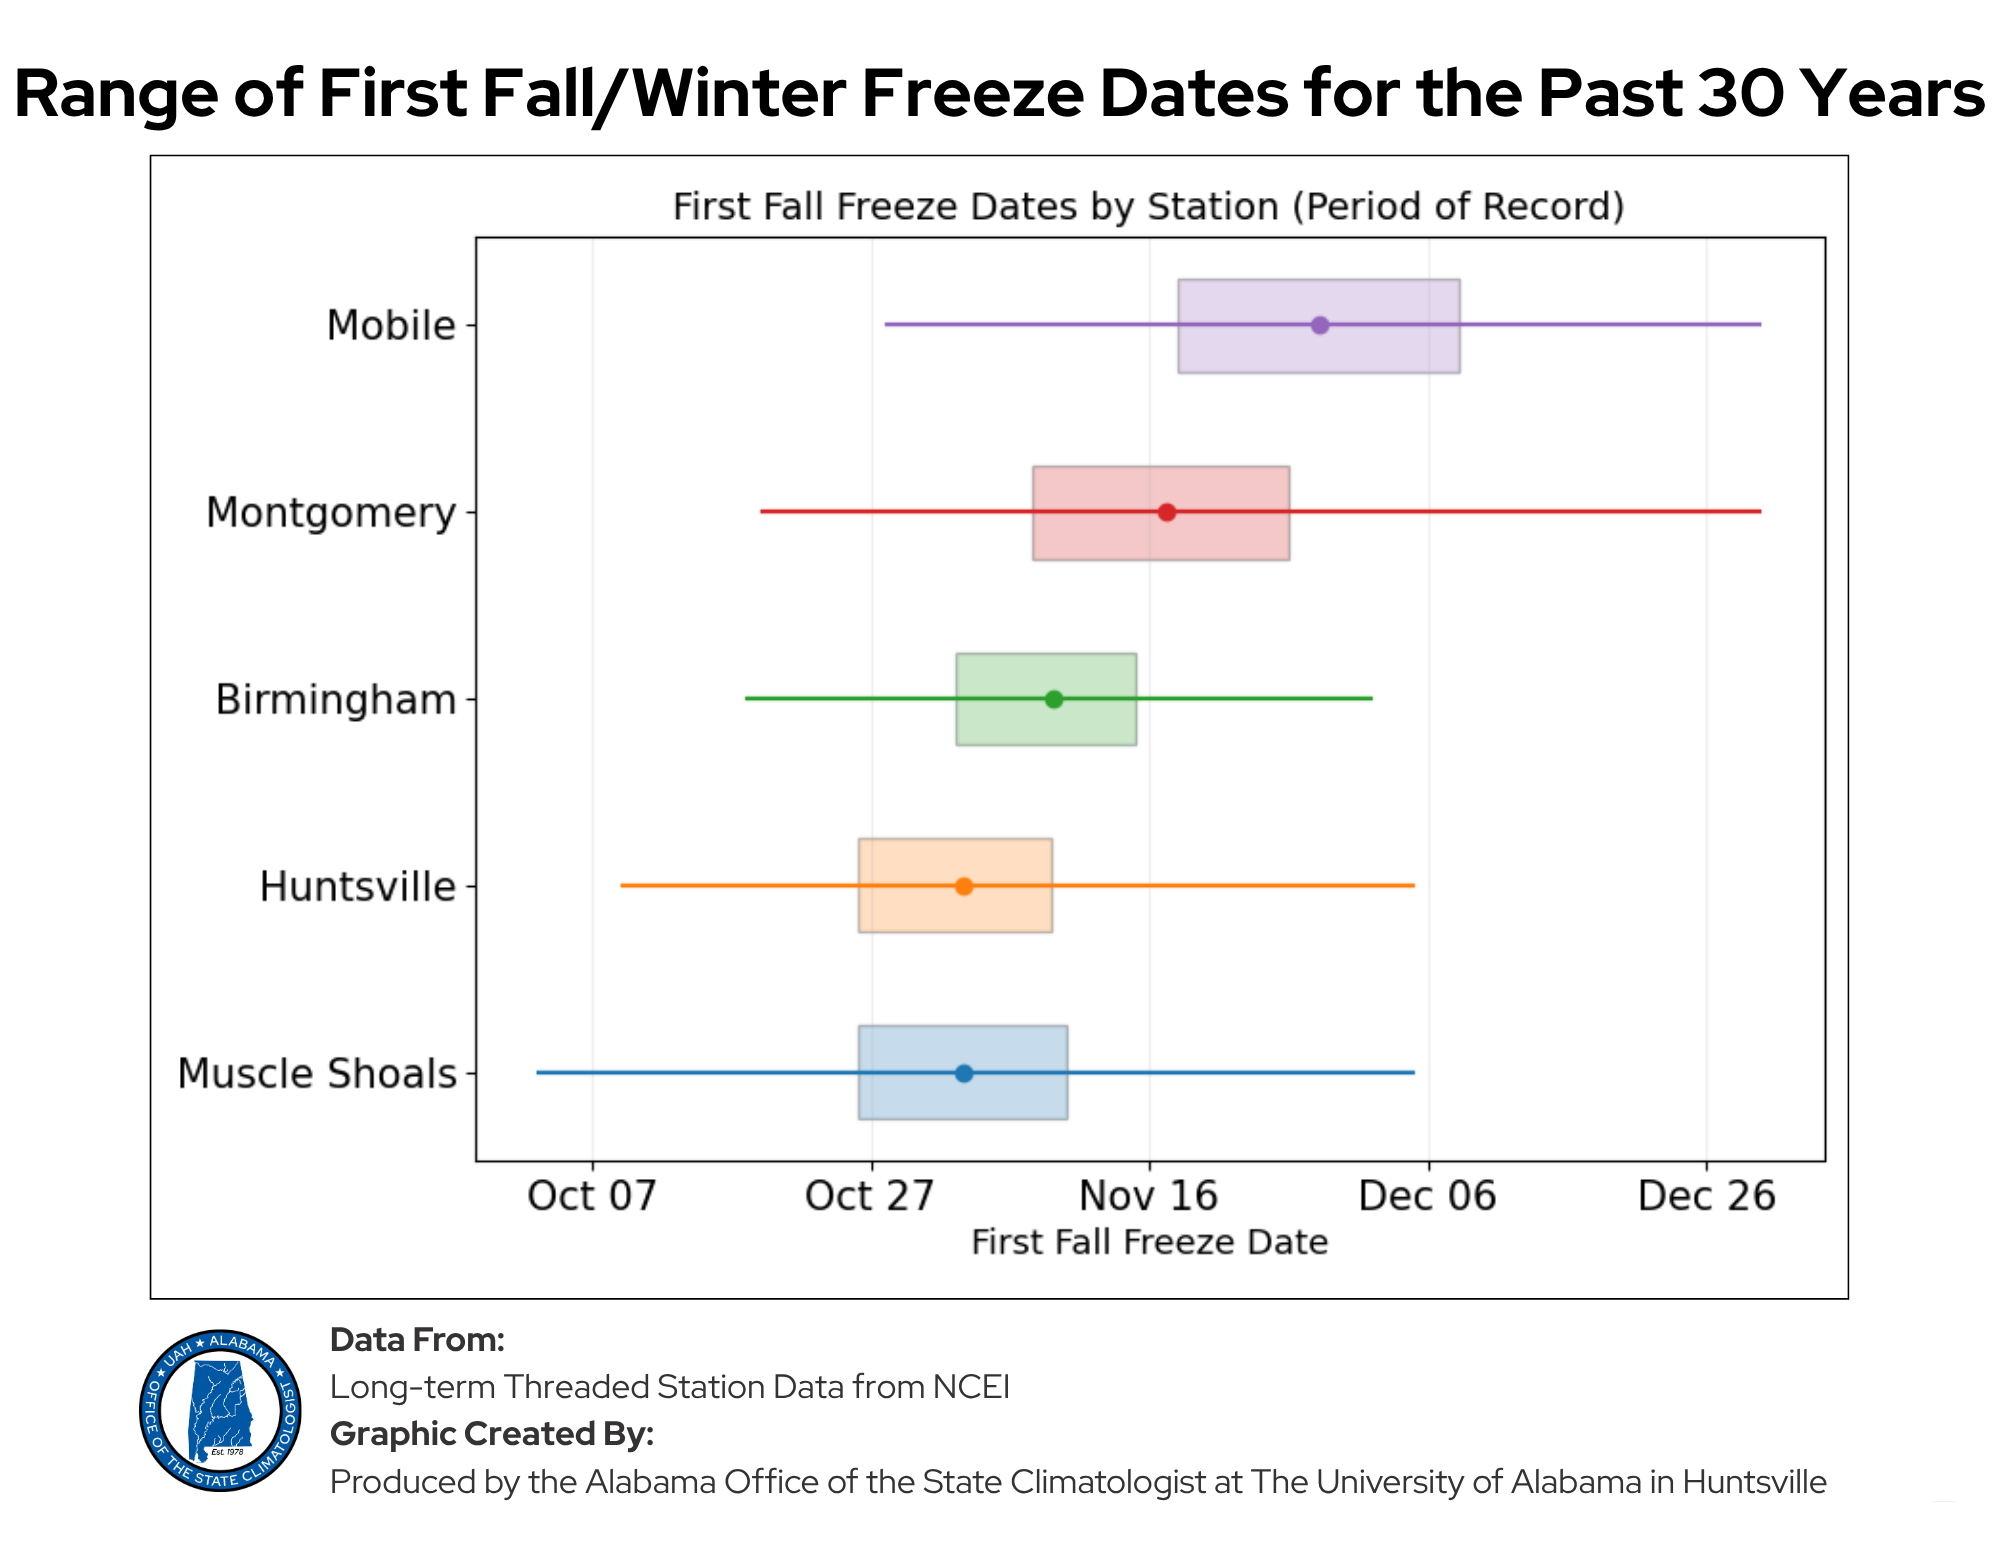
*This information is from threaded weather stations. A “threaded station” is a continuous long-term climate record created by linking (“threading”) data from multiple station locations within the same city or region when instruments have been relocated over time. This process reconciles overlapping and successive records to produce a single, consistent time series suitable for calculating official daily temperature and precipitation extremes.
Does the ENSO Cycle Play a Role Here?
We often get asked about ENSO signals and their influence on Alabama’s climate. This is especially true since we currently have a strong El Niño. ENSO (El Niño–Southern Oscillation) affects the position and strength of the jet stream over the Southeastern United States, particularly during winter and early spring. El Niño winters generally favor cooler, wetter conditions across the Southeast, while La Niña winters tend to favor warmer, drier conditions. However, these seasonal patterns do not necessarily translate into predictable changes in the timing of Alabama's first fall frost or freeze.
We examined the relationship between ENSO and first fall frost and freeze dates over the past 75 years (1950–2025). Across Alabama, El Niño years generally show slightly later first freeze dates than La Niña years. The differences are typically on the order of several days to about a week. First frost dates show a similar pattern. Huntsville is an exception, with slightly earlier first frosts during El Niño years.
Importantly, there is considerable overlap between ENSO phases at every location, and substantial year-to-year variability remains. While ENSO may slightly shift the odds of a later first frost or freeze, it is not a reliable predictor of when the first cold event will occur at any individual location (Figures 15 and 16).
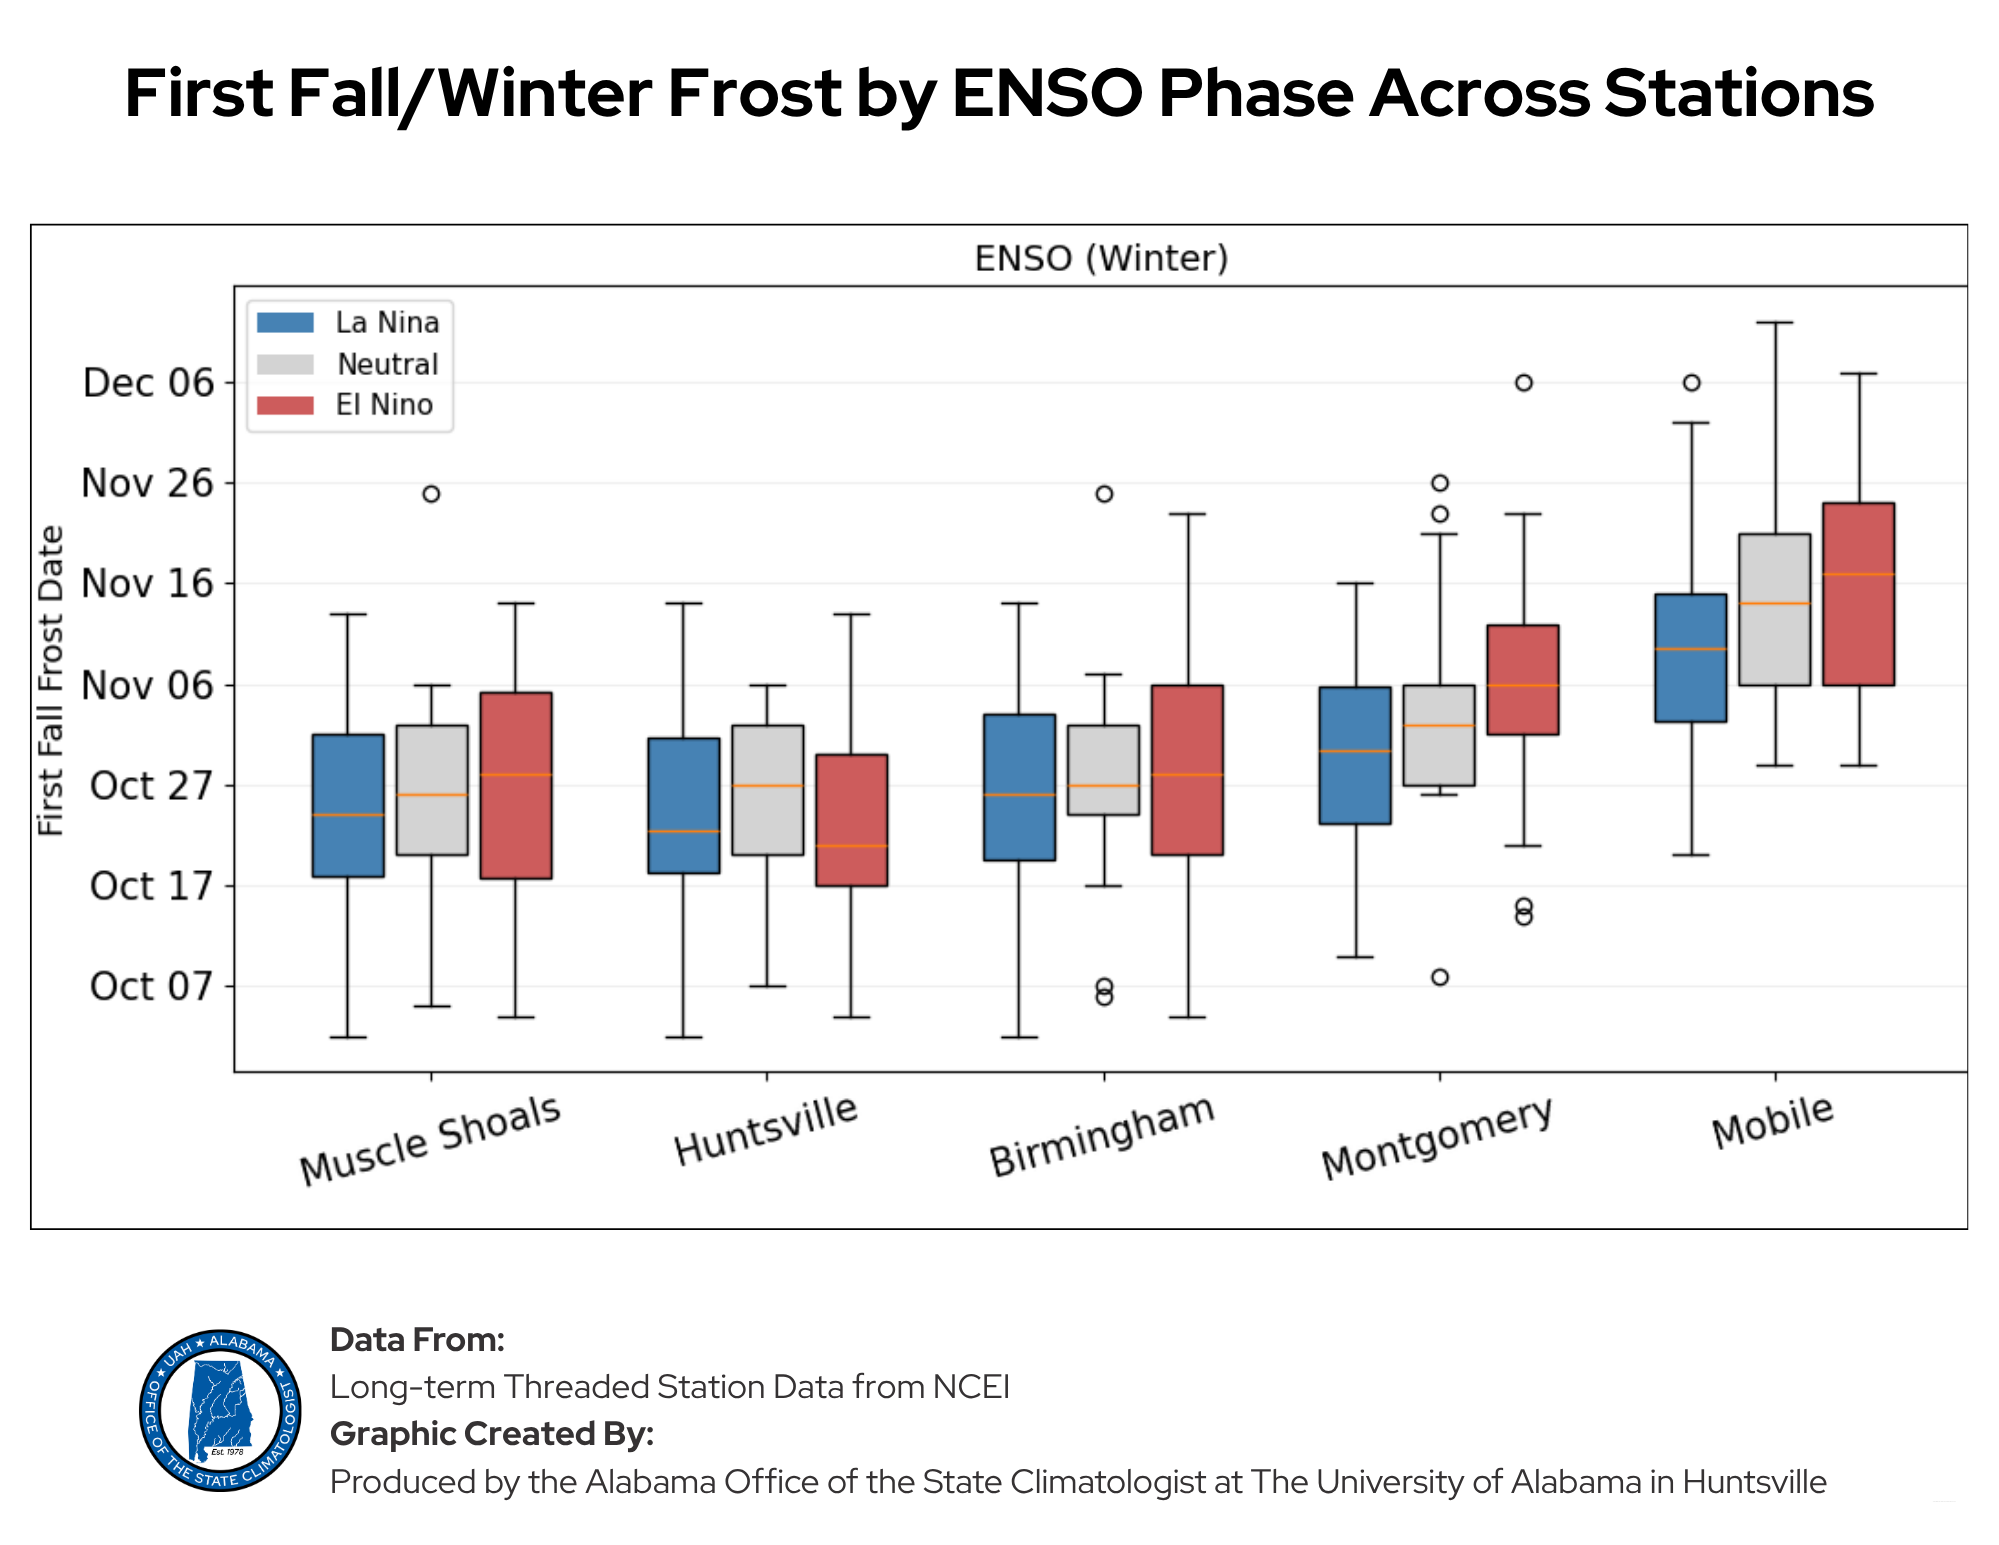
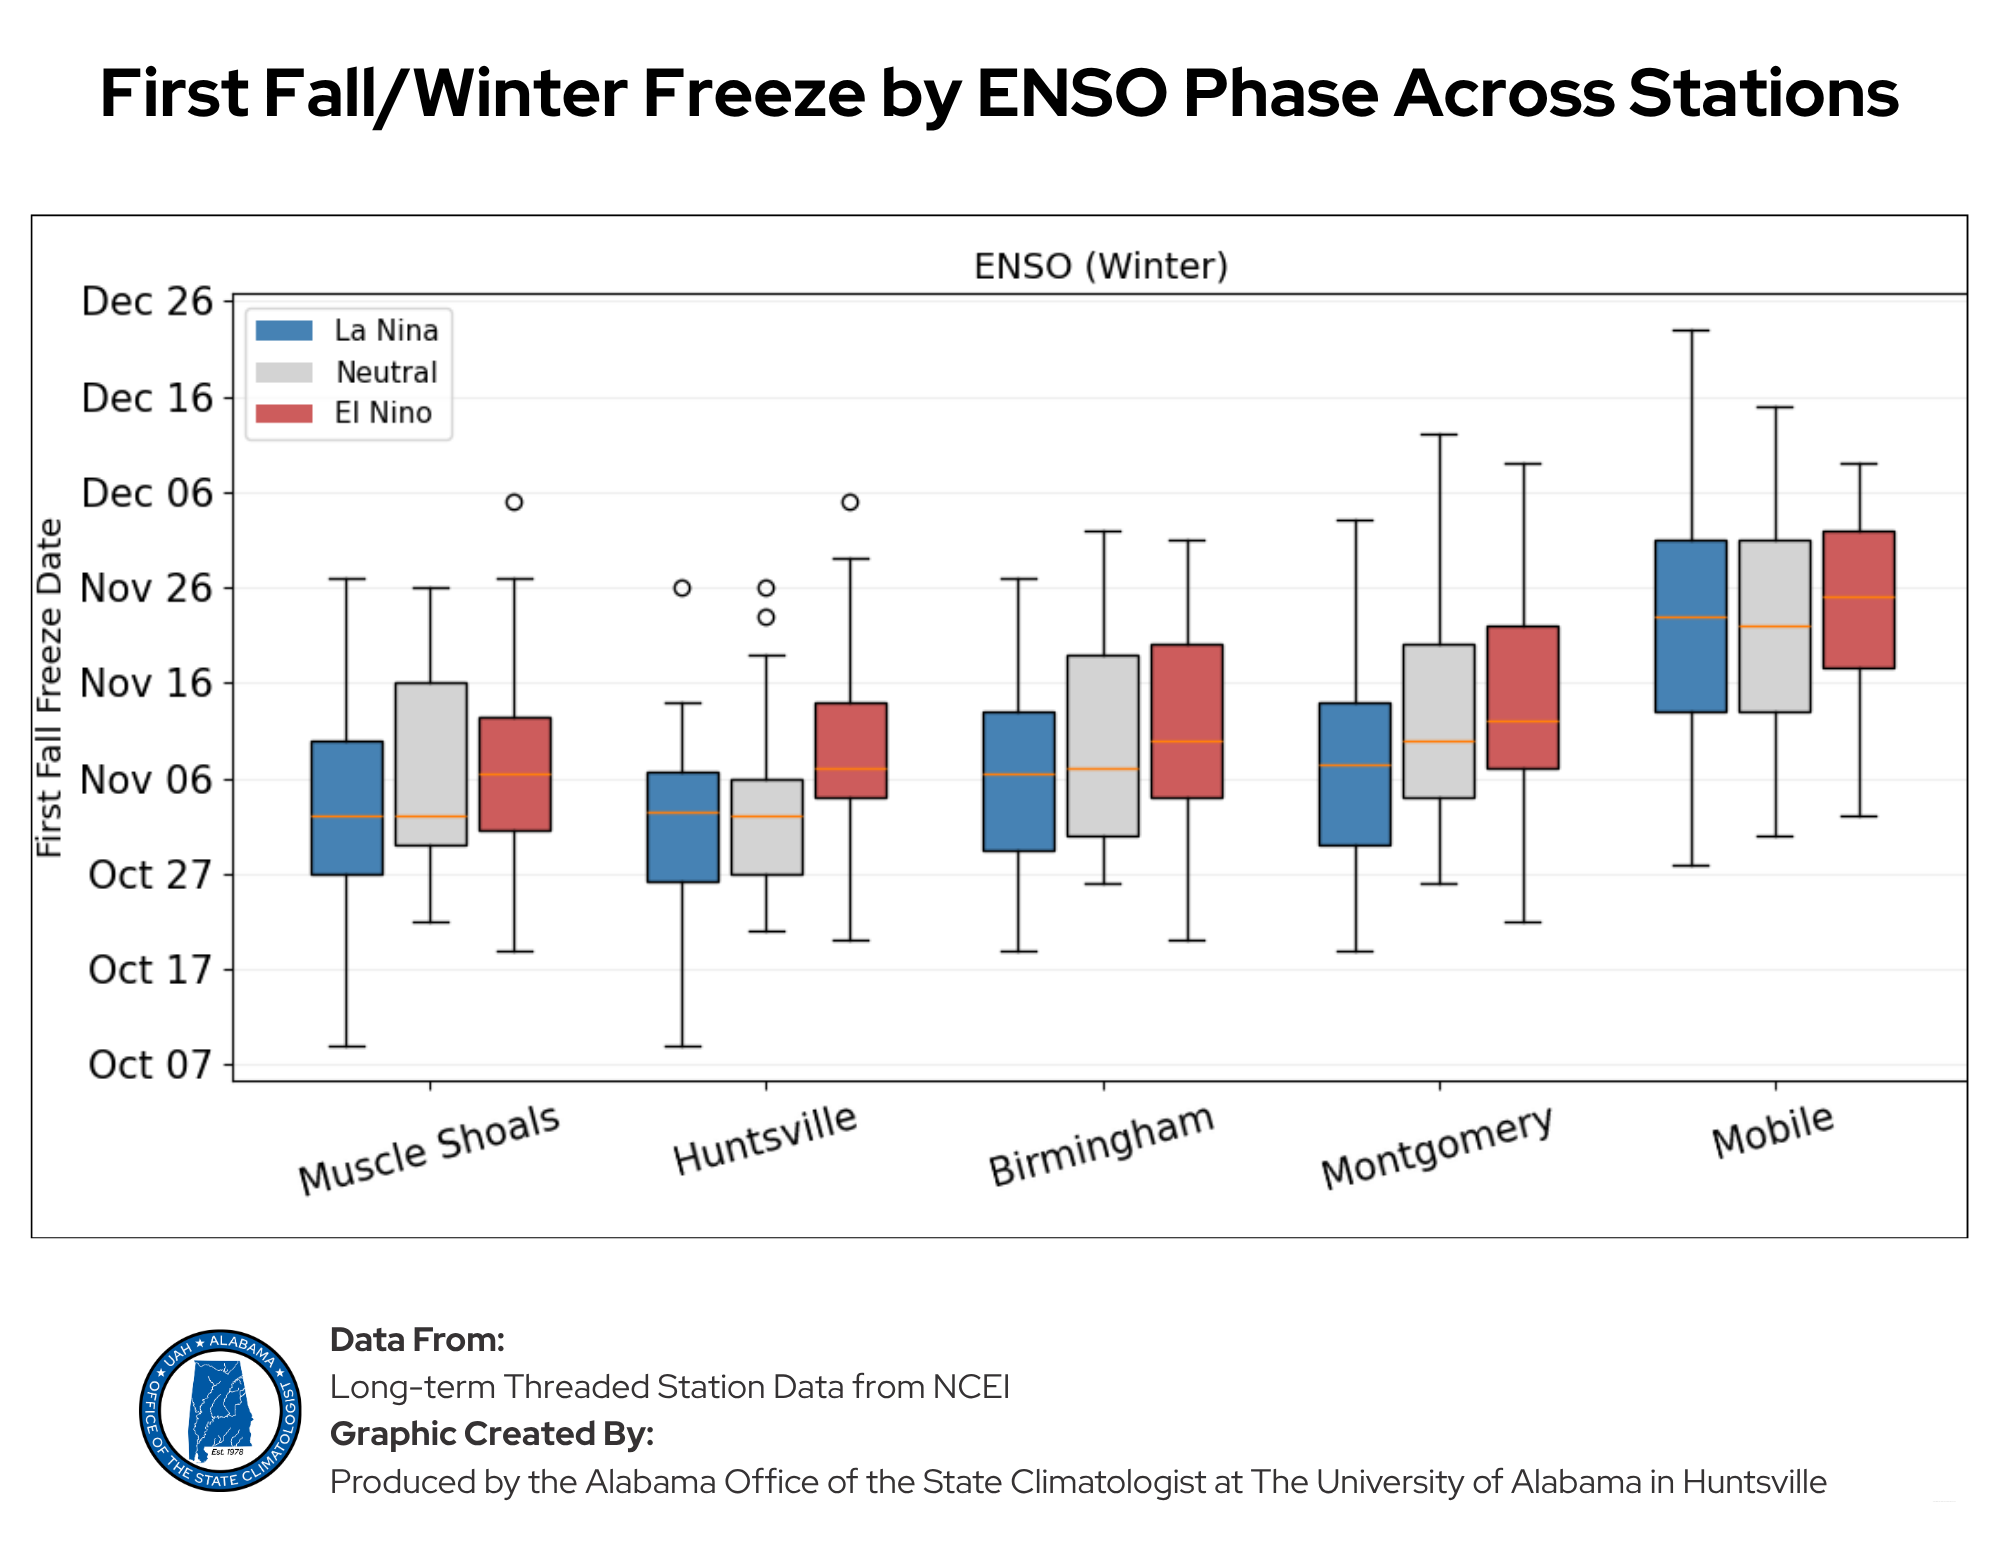
*The ENSO data is from https://psl.noaa.gov/data/timeseries/month/DS/Nino34_CPC/ and Niño 3.4 is the area averaged anomalies over the Niño 3.4 region (5N-5S)(170-120W) using a climatology of 1981-2010.
| Earliest First Frost | Latest First Frost | Earliest First Freeze | Latest First Freeze | |||||||
| Station | Name | Date | Year | Date | Year | Date | Year | Date | Year | # Years of Recorded Data |
| USC00010160 | ALEXANDER CITY, AL US | 10/2 | 1984 | 12/1 | 2021 | 10/19 | 2022 | 12/5 | 1978 | 57 |
| USW00013871 | ANNISTON METRO AP, AL US | 9/22 | 1903 | 12/1 | 1944 | 10/10 | 2000 | 12/1 | 1944 | 123 |
| USC00010402 | ATMORE, AL US | 10/17 | 1943 | 1/2 | 1945 | 10/27 | 1957 | 1/7 | 1954 | 86 |
| USC00010505 | BANKHEAD L&D, AL US | 9/23 | 1999 | 12/5 | 1978 | 10/15 | 1988 | 12/5 | 1978 | 69 |
| USC00010583 | BAY MINETTE, AL US | 10/13 | 1977 | 1/3 | 1919 | 10/20 | 1989 | 1/5 | 1972 | 113 |
| USC00010655 | BELLE MINA 2 N, AL US | 9/29 | 1967 | 11/13 | 1986 | 10/2 | 1984 | 11/26 | 2004 | 77 |
| USC00010764 | BESSEMER 3 WSW, AL US | 10/2 | 1984 | 11/21 | 2024 | 10/7 | 1980 | 12/2 | 2004 | 49 |
| USW00013876 | BIRMINGHAM AP, AL US | 10/2 | 1984 | 11/25 | 2004 | 10/18 | 1948 | 1/10 | 1932 | 97 |
| USC00011080 | BREWTON 3 ENE, AL US | 10/2 | 1984 | 11/26 | 2004 | 10/8 | 1991 | 12/16 | 1998 | 49 |
| USC00011620 | CHILDERSBURG WTP, AL US | 9/23 | 1999 | 11/14 | 2003 | 10/2 | 1984 | 11/16 | 1972 | 69 |
| USC00011694 | CLANTON, AL US | 9/30 | 1967 | 11/26 | 2004 | 10/11 | 1906 | 12/2 | 1918 | 133 |
| USC00011725 | CLAYTON, AL US | 10/10 | 2000 | 12/5 | 1978 | 10/12 | 2000 | 12/10 | 1978 | 98 |
| USW00013839 | DOTHAN RGNL AP, AL US | 10/14 | 1992 | 12/18 | 1998 | 10/28 | 2001 | 1/6 | 1972 | 57 |
| USC00012813 | FAIRHOPE 2 NE, AL US | 10/18 | 1948 | 1/2 | 1932 | 10/24 | 1937 | 1/11 | 1932 | 109 |
| USC00012883 | FAYETTE, AL US | 9/29 | 1942 | 11/17 | 2024 | 10/3 | 1974 | 12/2 | 2004 | 134 |
| USC00013154 | GADSDEN, AL US | 9/30 | 1967 | 11/16 | 2016 | 10/17 | 1954 | 1/2 | 1979 | 73 |
| USC00013160 | GAINESVILLE LOCK, AL US | 10/2 | 1984 | 11/25 | 2004 | 10/20 | 2022 | 12/5 | 1978 | 78 |
| USC00013251 | GENEVA #2, AL US | 10/2 | 1984 | 12/6 | 1986 | 10/19 | 2022 | 12/27 | 1986 | 50 |
| USC00013511 | GREENSBORO, AL US | 10/8 | 1987 | 1/3 | 1932 | 10/18 | 1948 | 1/9 | 1932 | 136 |
| USC00013519 | GREENVILLE, AL US | 10/14 | 1977 | 1/3 | 1932 | 10/17 | 1977 | 1/10 | 1932 | 126 |
| USC00013573 | GUNTERSVILLE, AL US | 10/9 | 1988 | 12/1 | 1975 | 10/14 | 1977 | 12/21 | 2001 | 122 |
| USC00013620 | HALEYVILLE, AL US | 9/27 | 1975 | 11/24 | 2004 | 10/3 | 1974 | 12/2 | 1946 | 124 |
| USC00013645 | HAMILTON 3 S, AL US | 9/22 | 1983 | 11/2 | 2002 | 9/29 | 1967 | 11/21 | 2024 | 65 |
| USC00013775 | HEFLIN, AL US | 9/28 | 1962 | 11/7 | 1981 | 9/30 | 1967 | 12/7 | 2010 | 71 |
| USW00003856 | HUNTSVILLE INTL AP, AL US | 10/2 | 1946 | 11/14 | 1975 | 10/9 | 2000 | 12/5 | 1978 | 68 |
| USC00014193 | JACKSON, AL US | 10/11 | 2000 | 12/17 | 2004 | 10/19 | 2022 | 12/17 | 2004 | 65 |
| USC00014502 | LAFAYETTE 2W, AL US | 10/2 | 1984 | 11/14 | 1986 | 10/7 | 1964 | 11/30 | 1990 | 82 |
| USC00015121 | MARION JUNCTION 2 NE, AL US | 9/30 | 1967 | 11/16 | 1972 | 10/19 | 2022 | 12/5 | 1978 | 76 |
| USW00013838 | MOBILE DWTN AP, AL US | 10/27 | 1957 | 12/18 | 1998 | 11/7 | 1959 | 1/21 | 2019 | 79 |
| USW00013894 | MOBILE, AL US | 10/18 | 1948 | 12/12 | 2004 | 10/28 | 1957 | 1/5 | 1972 | 78 |
| USW00013895 | MONTGOMERY AP, AL US | 10/8 | 1991 | 12/6 | 1978 | 10/19 | 2022 | 12/12 | 1994 | 79 |
| USC00015635 | MOULTON 2, AL US | 9/30 | 1967 | 11/13 | 1986 | 10/2 | 1984 | 11/26 | 2004 | 69 |
| USW00013896 | MUSCLE SHOALS RGNL AP, AL US | 10/2 | 1984 | 11/25 | 2004 | 10/9 | 2000 | 12/5 | 1978 | 86 |
| USC00016121 | ONEONTA, AL US | 9/18 | 1903 | 11/15 | 2015 | 9/30 | 1967 | 11/28 | 2004 | 132 |
| USC00016129 | OPELIKA, AL US | 9/30 | 1967 | 11/29 | 1992 | 10/10 | 2000 | 1/1 | 2026 | 69 |
| USC00017025 | ROCK MILLS, AL US | 9/25 | 2001 | 11/11 | 2016 | 9/30 | 1967 | 11/15 | 1975 | 88 |
| USC00017131 | RUSSELLVILLE #2, AL US | 9/22 | 1983 | 11/15 | 2003 | 9/29 | 1967 | 11/27 | 2009 | 73 |
| USC00017157 | SAINT BERNARD, AL US | 9/21 | 1918 | 12/15 | 2017 | 10/1 | 1924 | 12/20 | 2001 | 119 |
| USC00017207 | SAND MT SUBSTN, AL US | 9/23 | 1982 | 11/14 | 2003 | 10/2 | 1984 | 11/26 | 2004 | 78 |
| USC00017304 | SCOTTSBORO, AL US | 9/22 | 1913 | 11/14 | 1919 | 10/3 | 1974 | 12/1 | 1918 | 135 |
| USC00017366 | SELMA, AL US | 10/10 | 1915 | 12/5 | 1978 | 10/21 | 1913 | 1/5 | 1924 | 132 |
| USC00017999 | SYLACAUGA 4 NE, AL US | 9/25 | 1990 | 11/14 | 2003 | 9/30 | 1967 | 11/24 | 1972 | 76 |
| USC00018024 | TALLADEGA, AL US | 9/28 | 1899 | 11/14 | 1919 | 10/4 | 1987 | 11/23 | 2024 | 138 |
| USC00018209 | THORSBY EXP STN, AL US | 10/2 | 1984 | 11/23 | 2015 | 10/17 | 1978 | 12/9 | 2017 | 69 |
| USC00018323 | TROY, AL US | 10/17 | 1943 | 1/3 | 1932 | 10/18 | 1943 | 1/10 | 1932 | 118 |
| USW00093806 | TUSCALOOSA MUNI AP, AL US | 10/2 | 1984 | 12/1 | 1978 | 10/10 | 2000 | 12/6 | 1978 | 78 |
| USC00018469 | VALLEY HEAD, AL US | 9/16 | 1940 | 11/23 | 1933 | 9/22 | 1983 | 11/23 | 1933 | 134 |
| USC00018517 | VERNON, AL US | 9/23 | 1982 | 11/14 | 2003 | 10/2 | 1984 | 12/2 | 2004 | 88 |
| USC00018998 | WINFIELD 2 SW, AL US | 9/22 | 1983 | 11/10 | 2016 | 10/2 | 1984 | 11/21 | 2024 | 103 |