Written by: Brianne Minton
Technical Expertise from: Dr. Rob Junod, Dr. Lee Ellenburg, Michael Solomon, & Alexandria Cox
Anyone who lives in Alabama knows fall is a total wild card. One year it feels like Summer: Part II, and the next we get hit with a quick preview of winter. We might get a few of those beautiful, crisp mornings that make you want to break out a sweater, but Alabamians know better than to trust those initial cool spells. Between sudden cold fronts and tropical storm rain, no two autumns ever look or feel the same. Looking back at more than 130 years of climate records shows just how wide that seasonal range can be.
Statewide Temperature & Precipitation Trends
All-Time Numbers
Alabama’s fall temperature records showcase these big swings clearly, with 1976 standing out as the ultimate record-breaker for cold weather. That single year swept every cool record on the books, setting the marks for the coolest average temperature (58.6°F), coolest average daily high temps (70.6°F), and coolest average nighttime temps (46.6°F). On the warmer side of the spectrum, average overall temperatures reached as high as 68.7°F in 1919 and 1931. Daytime highs peaked in 2016 with a record average high of 82.4°F, while 1919 and 2004 tied for the warmest average low at 56.8°F.
Rainfall amounts across the state show an even wider gap. While Alabama typically sees about 11.86 inches of rain, seasonal totals can deviate significantly. The driest fall on record occurred in 1897 with only 3.81 inches of rain, while the wettest fall in 1929 brought 21.01 inches. While seasonal totals can swing from very wet to very dry, autumn is historically Alabama’s driest season on average. Part of this variability is tied to Atlantic tropical systems, which can deliver heavy rainfall to coastal and southern regions, though their impact is often far less pronounced across central and northern Alabama.
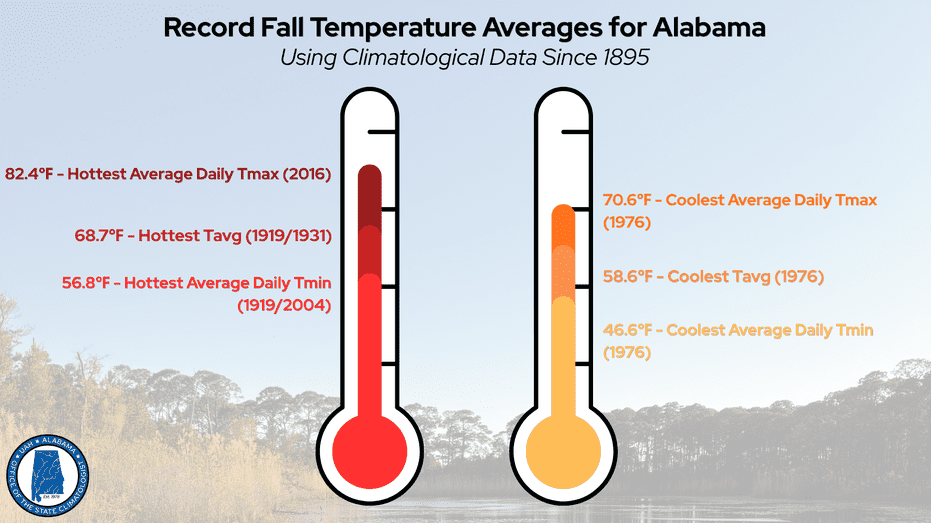
Figure 1. Thermometer visualization of record fall temperatures.
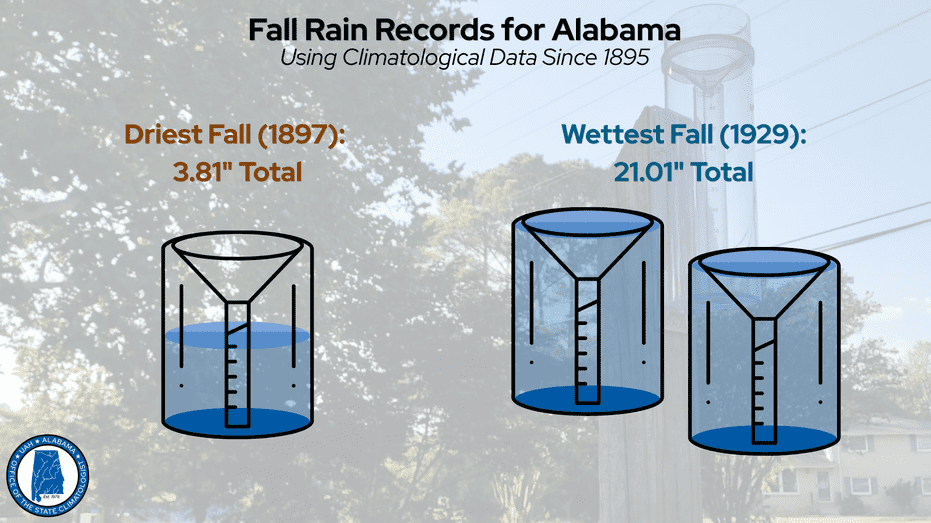
Figure 2. Rain gauge visualization of record fall precipitation.
|
Fall Temperature and Precipitation Records | ||
|---|---|---|
| Category | Record | Year |
| Hottest Average Fall Temperature | 68.7℉ | 1919 & 1931 |
| Coolest Average Fall Temperature | 58.6℉ | 1976 |
| Hottest Average Daily Maximum Temperature | 82.4℉ | 2016 |
| Coolest Average Daily Maximum Temperature | 70.6℉ | 1976 |
| Hottest Average Daily Minimum Temperature | 56.8℉ | 1919 & 2004 |
| Coolest Average Daily Minimum Temperature | 46.6℉ | 1976 |
| Driest Fall | 3.81” total rain | 1897 |
| Wettest Fall | 21.01” total rain | 1929 |
Climatological Period (Using 30-Year Normals from 1991-2020)
Fall Temperatures Across Alabama
- Coolest Regions (Blue & Purple Shades): The lowest temperatures in the following maps are represented by the cooler blue and purple tones concentrated largely across Northern Alabama, especially in higher elevation areas.
- Moderate Regions (Green & Yellow Shades): Milder temperatures appear in shades of green and yellow. These temperatures most often occur in Central Alabama, across popular cities like Tuscaloosa, Birmingham, and Auburn.
- Warmest Regions (Orange & Red Shades): The warmest temperatures stretch across southern Alabama, marked by deep orange and red hues. The warmest areas tend to be Gulf Coast communities and the Wiregrass region (Southeast counties)
Fall Average Temperature (°F)
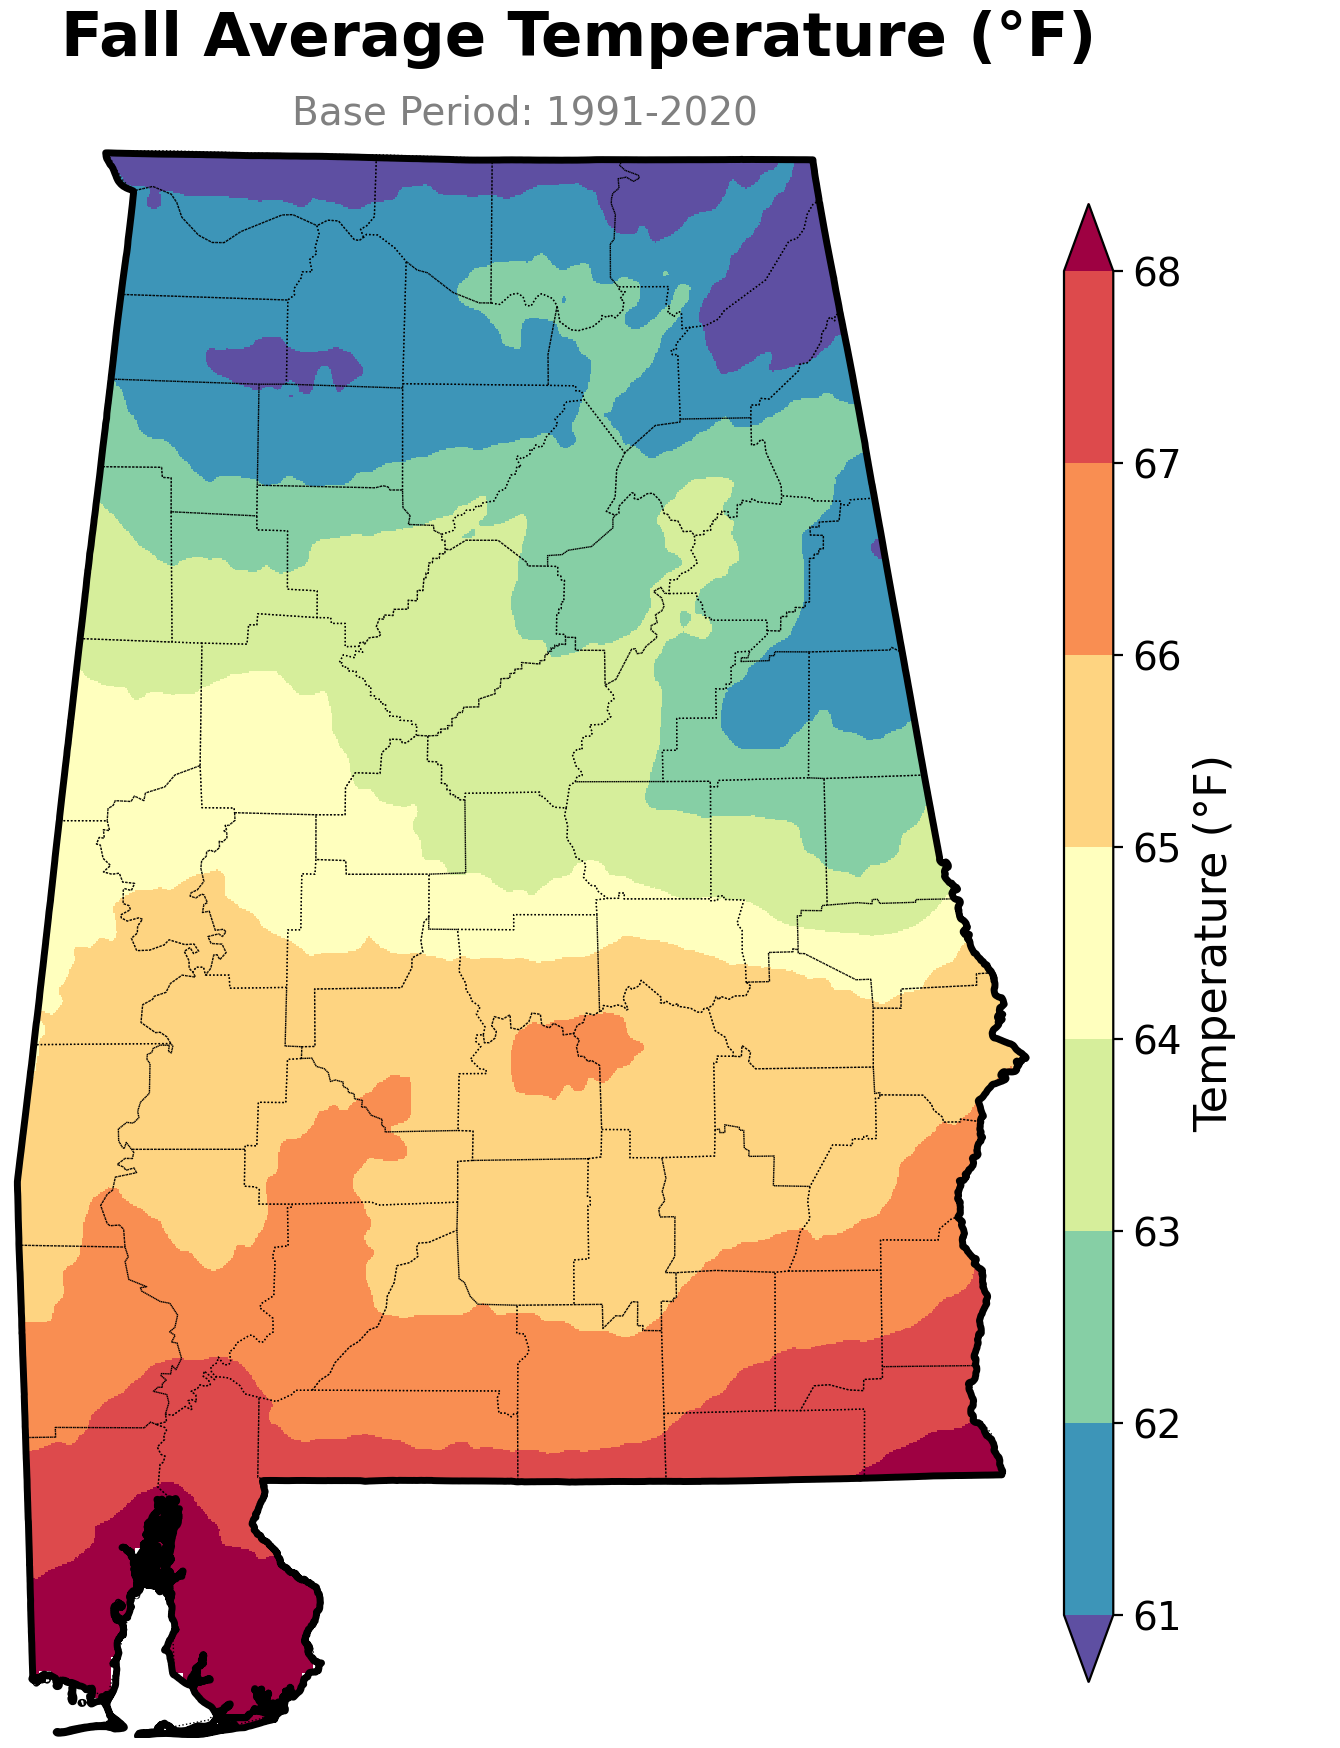
Figure 3. Fall average temperatures across Alabama from 1991 to 2020. Based on NClimGrid dataset
Fall Average Low Temperature (°F)
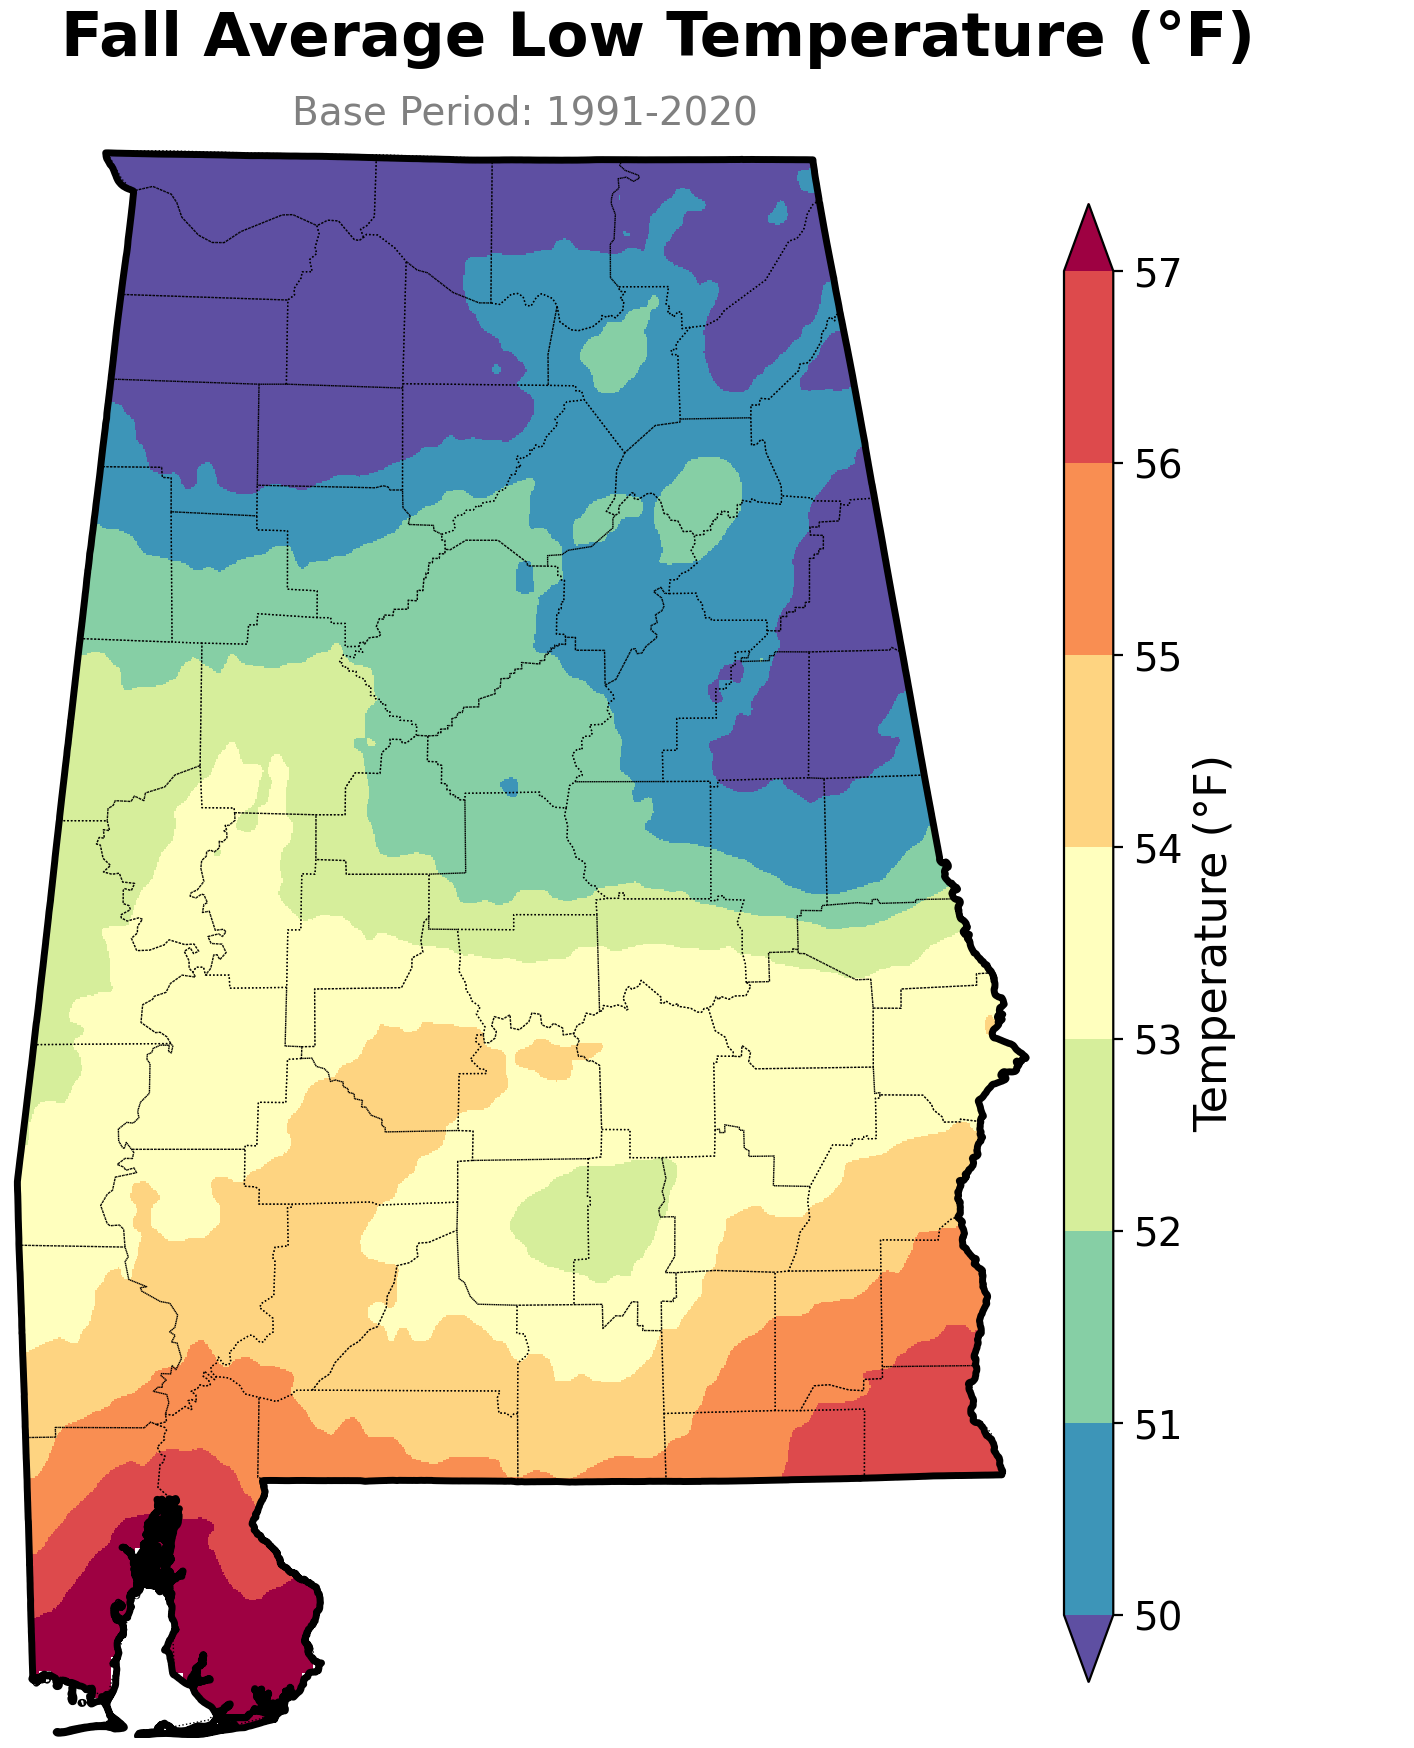
Figure 4. Fall average low temperatures across Alabama from 1991 to 2020. Based on NClimGrid dataset.
Fall Average High Temperature (°F)
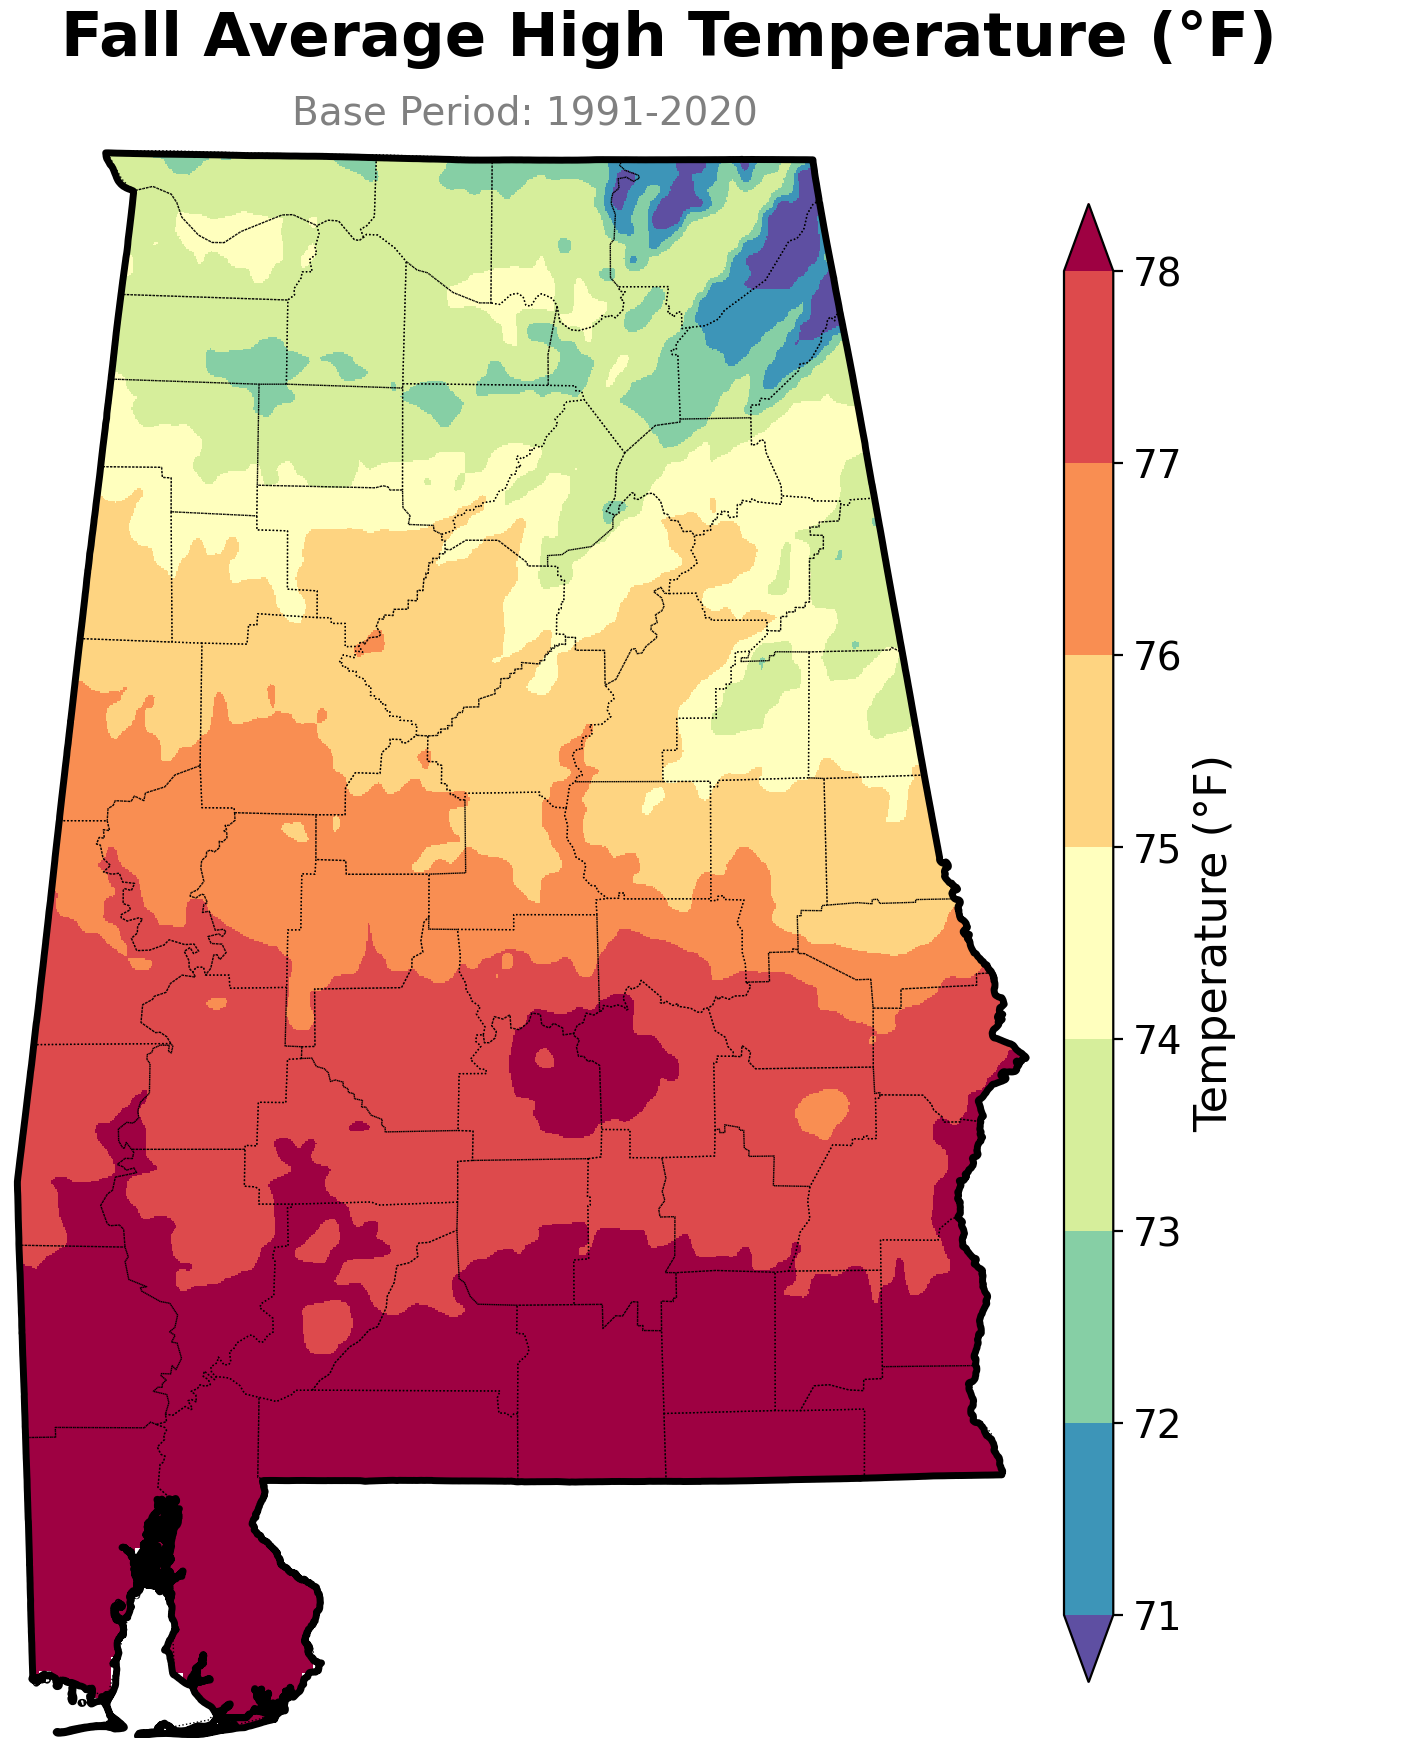
Figure 5. Fall average high temperatures across Alabama from 1991 to 2020. Based on NClimGrid dataset.
Fall Precipitation Across Alabama
- Driest Regions (Pale Yellow): The lowest fall precipitation totals (under 11 inches) are primarily concentrated along the Black Belt and parts of east-central Alabama.
- Moderate Regions (Light to Medium Green): Much of the state falls into this moderate category, with average autumn rainfall totals generally ranging between 11 and 14 inches.
- Wettest Regions (Blue-Green to Dark Blue): The highest fall precipitation amounts (ranging from 14 to over 18 inches) are mostly found along the Gulf Coast in Mobile and Baldwin counties, with additional pockets of heavier totals appearing along the Cumberland Plateau in northern Alabama.
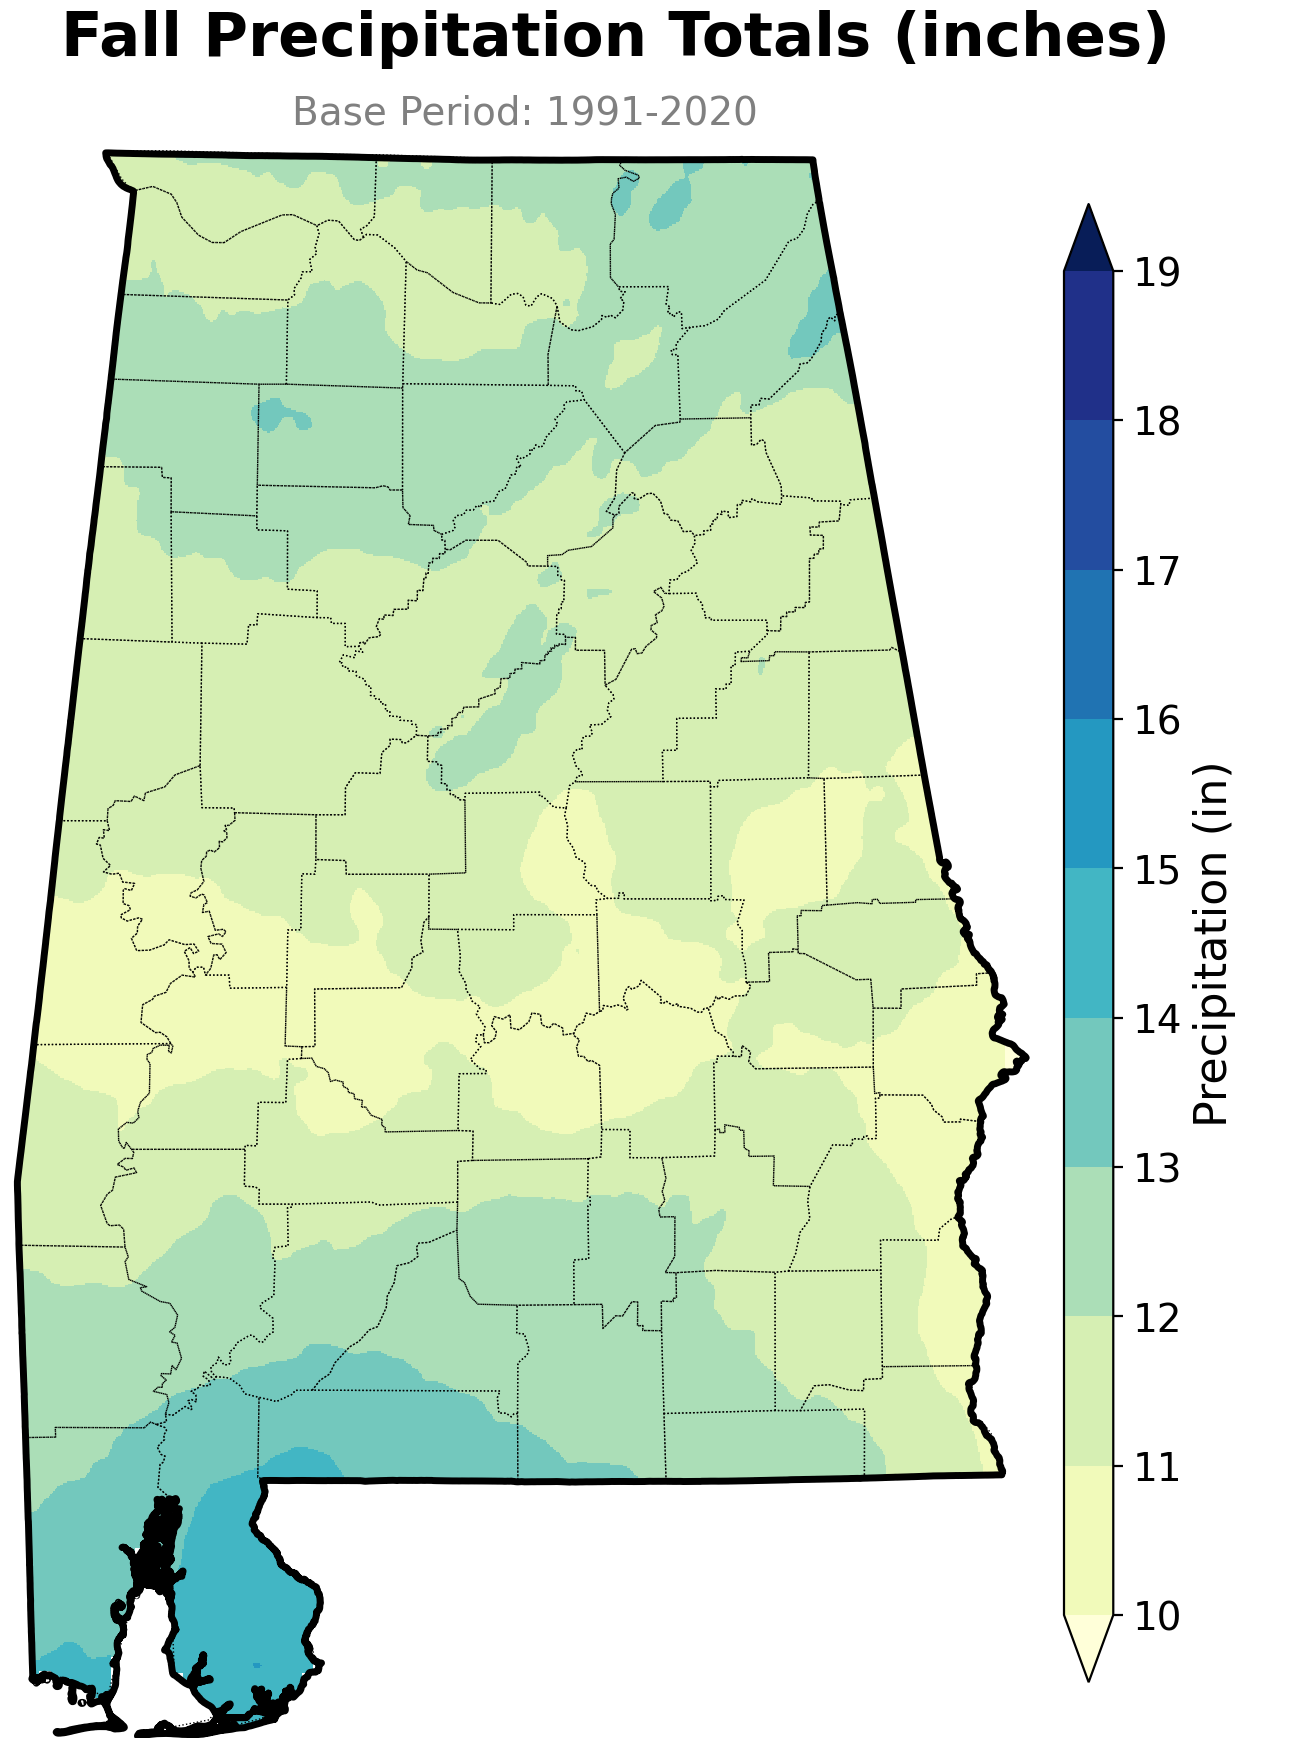
Figure 6. Fall precipitation totals across Alabama from 1991 to 2020. Based on NClimGrid dataset.
Seasonal Topic: Drought & Severe Weather
Fall Droughts in Alabama
As previously mentioned, Alabama’s fall precipitation is influenced by the Atlantic hurricane season. September is typically the most active month for us, but tropical systems can affect the state as late as November. Sometimes those systems bring buckets of rain across the state. Other times, they bypass us or don’t occur at all, leaving us high and dry. When that happens, drought conditions can develop quickly. Data from the U.S. Drought Monitor show that drought conditions typically increase during the fall with October historically having the greatest occurrence of drought on average.
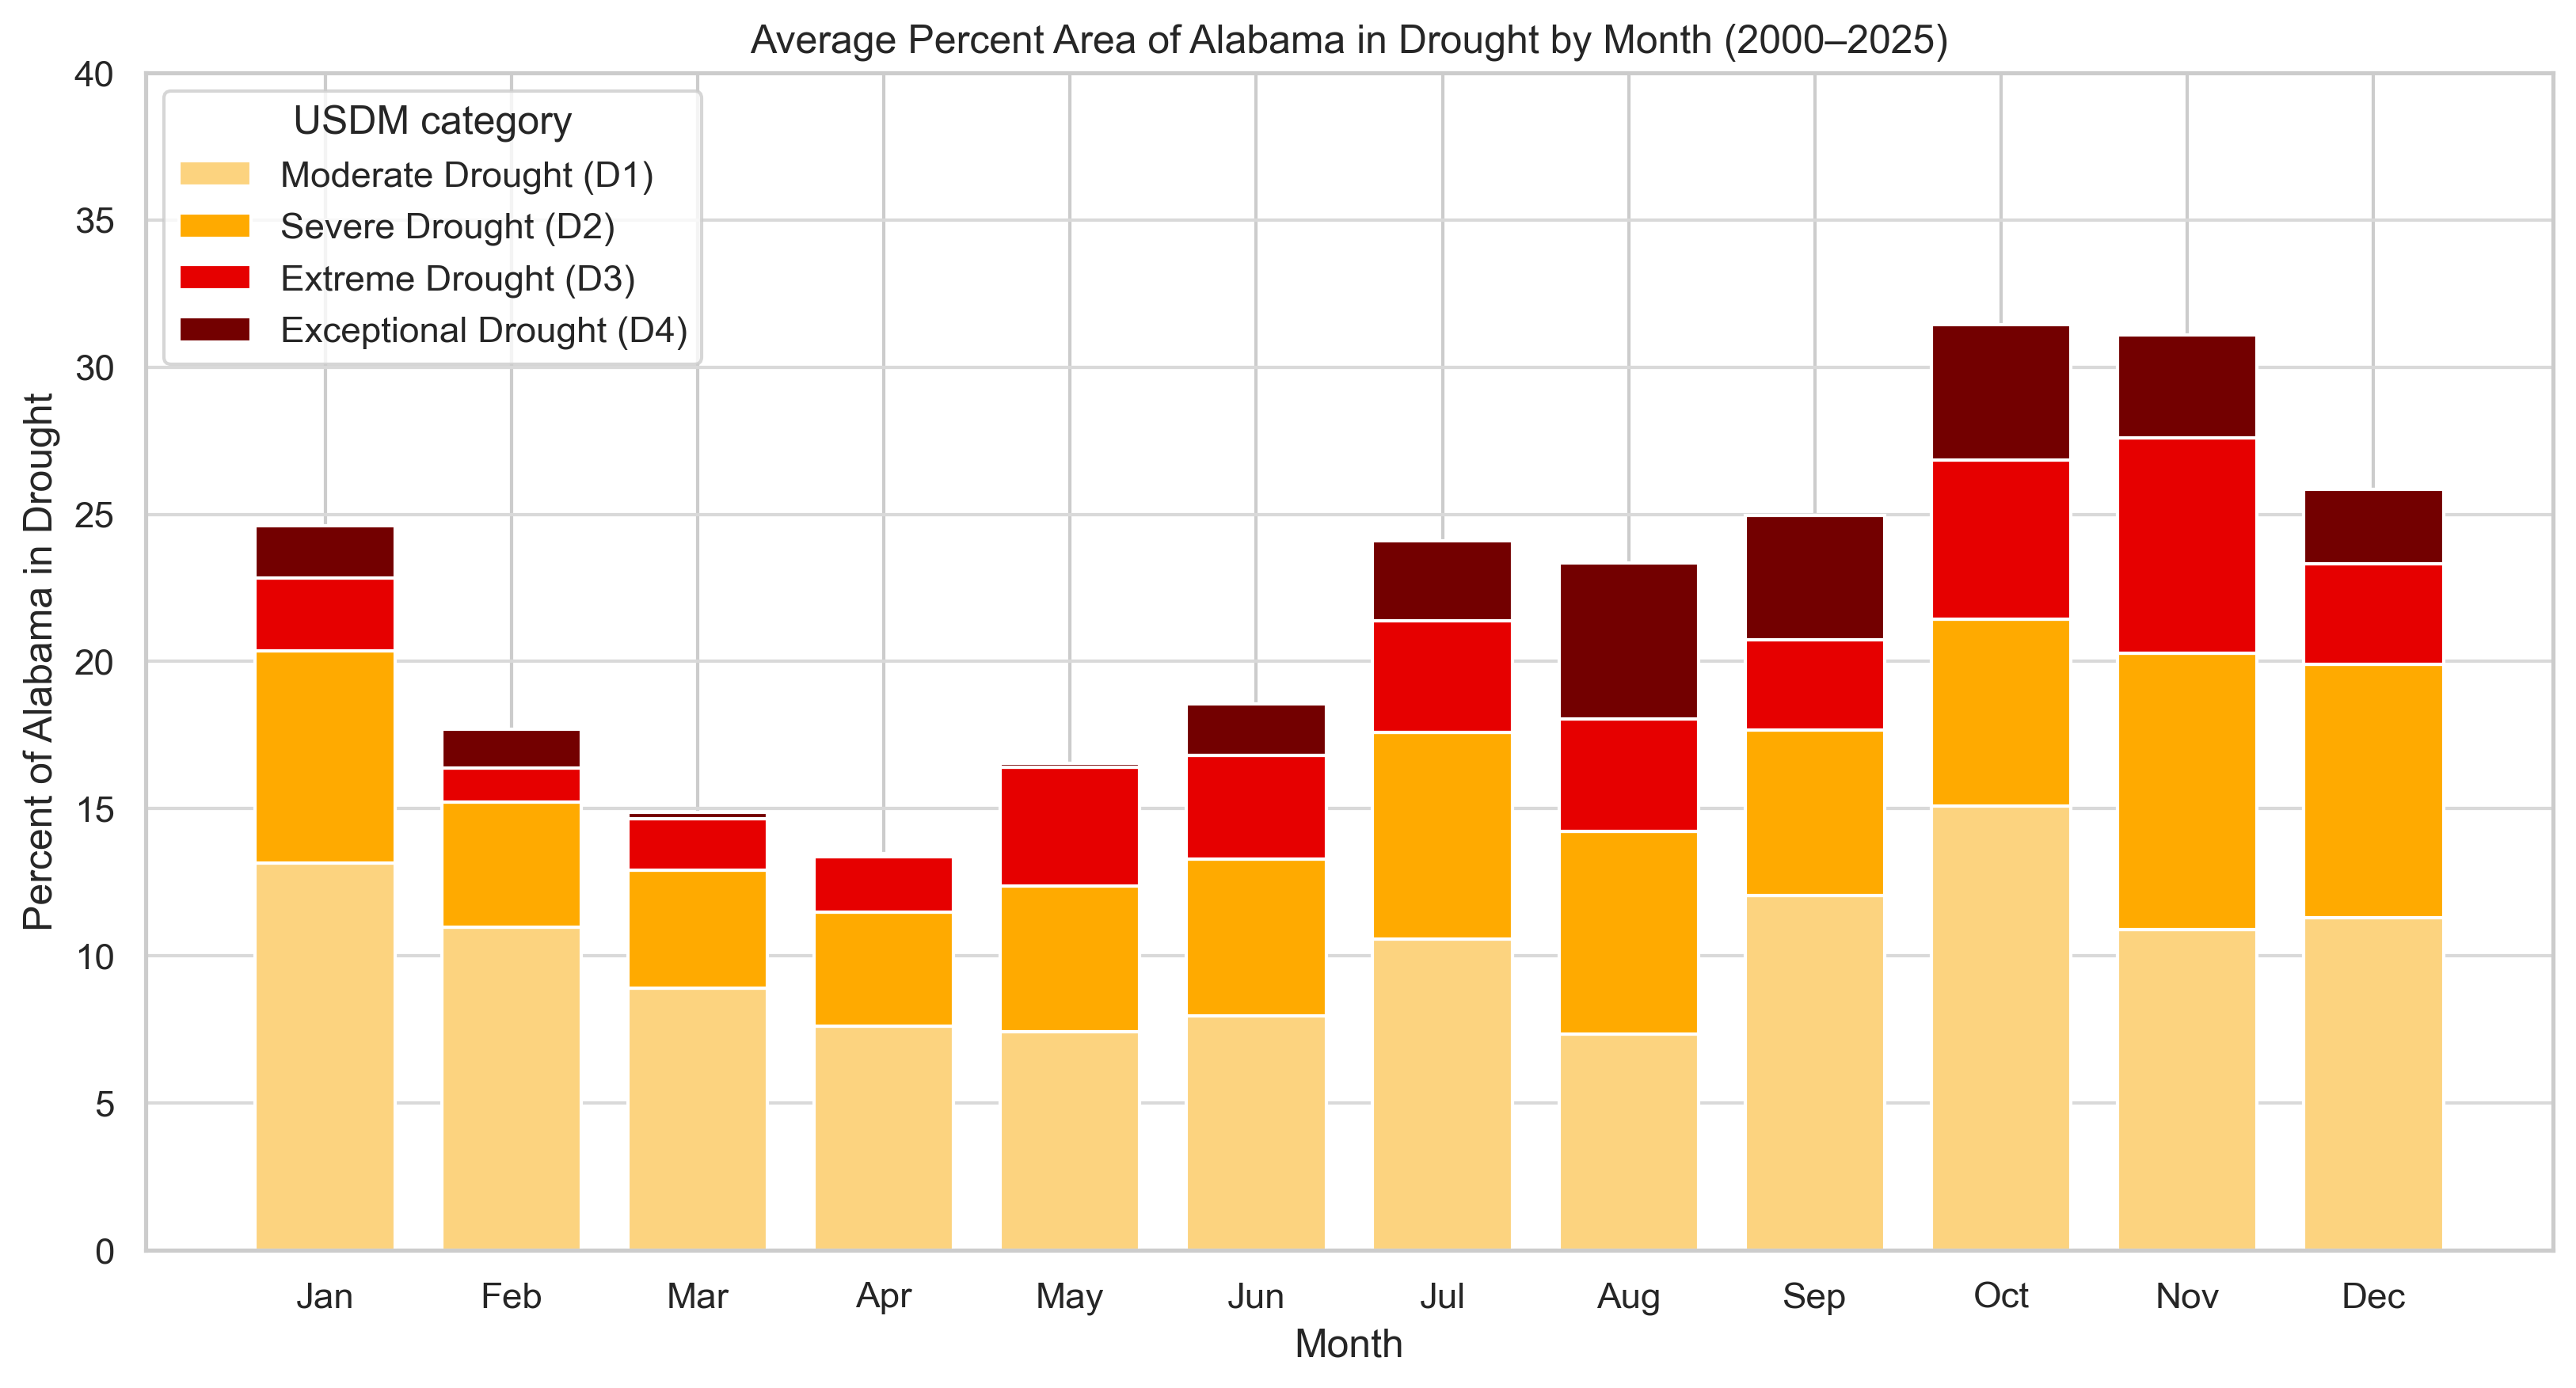
Figure 7. Average percentage of Alabama in each U.S. Drought Monitor category by month, 2000–2025.
Drought often comes with a negative connotation, but interestingly, fall drought can have some benefits depending on who you ask. In the agricultural sector, for example, dry weather can provide valuable time to harvest crops, get into the fields, and cut and dry hay. It can also reduce some fungal diseases. However, prolonged drought, or drought that occurs after an already dry summer, can create challenges like reduced water supplies for livestock and wildlife, increased insect pressure, and difficulty planting winter crops. Alabama Extension and Alabama Drought Reach are great resources for understanding agricultural drought across the state.
The U.S. Drought Monitor is one of the best resources for viewing drought conditions across the country. Each week, the Alabama Office of the State Climatologist helps provide feedback for Alabama’s portion of the map using a combination of observed and modeled weather data, drought and climate indices, and information on local conditions and reported impacts. We already have a lot of tools that help us do this, but you can actually help us by providing even more local data. You can help us monitor drought in Alabama!
- CMOR-Drought: Condition Monitoring Observer Reports let you quickly report what you’re seeing in your area. You can share information about dry soils, stressed vegetation, low water levels, and other signs or impacts of drought.
- CoCoRaHS: CoCoRaHS is a nationwide citizen science network where volunteers use approved rain gauges to measure and report rainfall. These observations help fill gaps between weather stations and give us a better picture of how much rain is falling across Alabama
Tornadoes
Fall is also a time of severe weather. When most Alabamians think of severe weather, they probably think of spring, but as fall progresses to winter, Alabama actually enters another period of increased severe weather activity. November, specifically, is the second most common month for tornadoes. Unlike the spring, late-fall storms often develop in environments with stronger vertical wind shear but less Convective Available Potential Energy (CAPE). This combination is known as a High-Shear, Low-CAPE (HSLC) environment. As the jet stream shifts farther southward during the transition into winter, stronger winds move into Alabama. These winds can change more quickly with height, and this wind shear can help organize thunderstorms and support rotating storms even when there is relatively little instability.
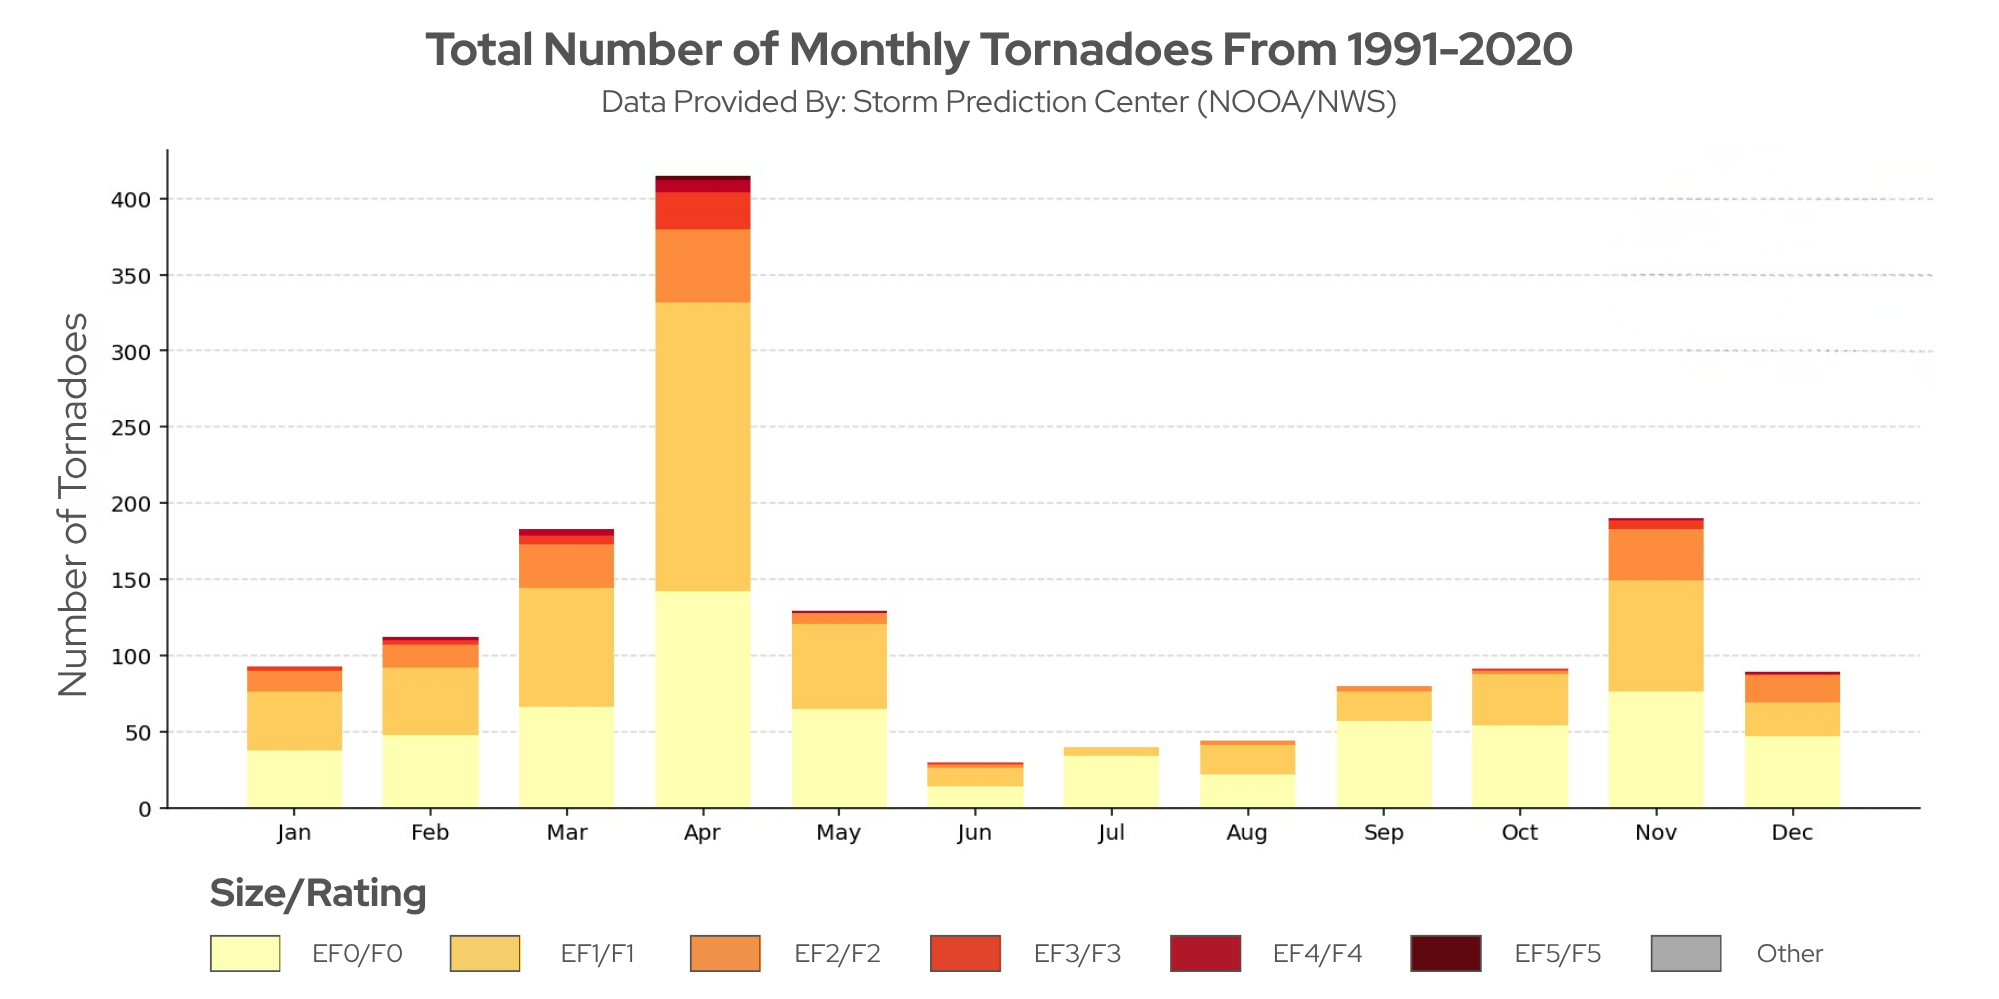
Figure 8. Total number of Alabama tornadoes by month, 1991–2020.
This combination helps explain why Alabama sees a secondary peak in tornado activity during November and December. Many of these tornadoes develop within larger storm systems called Quasi-Linear Convective Systems (QLCSs), more commonly known as squall lines. Unlike the isolated supercells often associated with spring, these storms can form as part of a larger line and still produce significant tornadoes. Late-fall tornadoes are also more likely to occur at night, making them harder to see and recognize. Some storms can be relatively low-topped, which can make it more difficult for radar to sample the rotating parts of the storm, especially when the storm is farther from the radar. Together, these factors make late-fall severe weather an important part of Alabama's overall severe weather climatology.
Fall may be a season of transition, but that does not mean it is a quiet one. From tropical rainfall and temperature swings to drought and a secondary severe weather season, Alabama’s fall weather can take many different turns.