Written by: Aurora Wornham & Cody Clark
Technical Expertise from: Michael Solomon, Dr. Rob Junod, Dr. Lee Ellenburg, & Brianne Minton
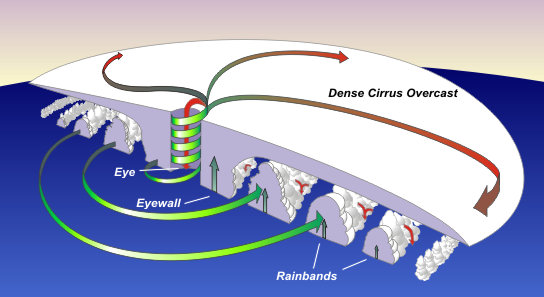
Hurricanes are a familiar part of life in Alabama, and their impacts can extend far beyond our relatively short coastline. Heavy rain, flooding, storm surge, strong winds, and tornadoes can affect communities across the state. Although the Atlantic hurricane season runs from June 1 through November 30, Alabama is most often affected in late summer and fall. Many Alabamians have a memorable hurricane experience, whether it was a storm making landfall nearby, days without power, or watching the forecast and wondering what might happen next.
What Is a Hurricane?
A hurricane is a type of tropical cyclone, a rotating storm that forms over warm tropical or subtropical waters. In the Atlantic and Northeast Pacific, these storms are called hurricanes, while similar storms in other parts of the world may be called typhoons or tropical cyclones.
Tropical cyclones are classified by their maximum sustained winds. A system becomes a tropical storm at 39 mph and a hurricane at 74 mph. Hurricanes are then categorized from 1 to 5 using the Saffir-Simpson Hurricane Wind Scale, with Category 3 and stronger storms considered major hurricanes. The scale measures wind speed only and does not account for hazards such as storm surge, rainfall, flooding, or tornadoes.
| Saffir-Simpson Hurricane Wind Scale | ||
|---|---|---|
| Category | Wind Speeds | Damage |
| 1 | 74-95 mph 119-153 km/h |
Dangerous winds will damage trees, roofs, and power lines, causing short-term outages |
| 2 | 96-110 mph 154-177 km/h |
Very dangerous winds will produce extensive damage to homes, trees, and infrastructure |
| 3 | 111-129 mph 178-208 km/h |
Extremely dangerous winds will cause devastating damage to homes, trees, and infrastructure |
| 4 | 130-156 mph 209-251 km/h |
Catastrophic damage will occur, leaving only the most well-built structures standing |
| 5 | 157 mph or higher 252 km/h or higher |
Catastrophic damage will occur, leaving most structures completely destroyed |
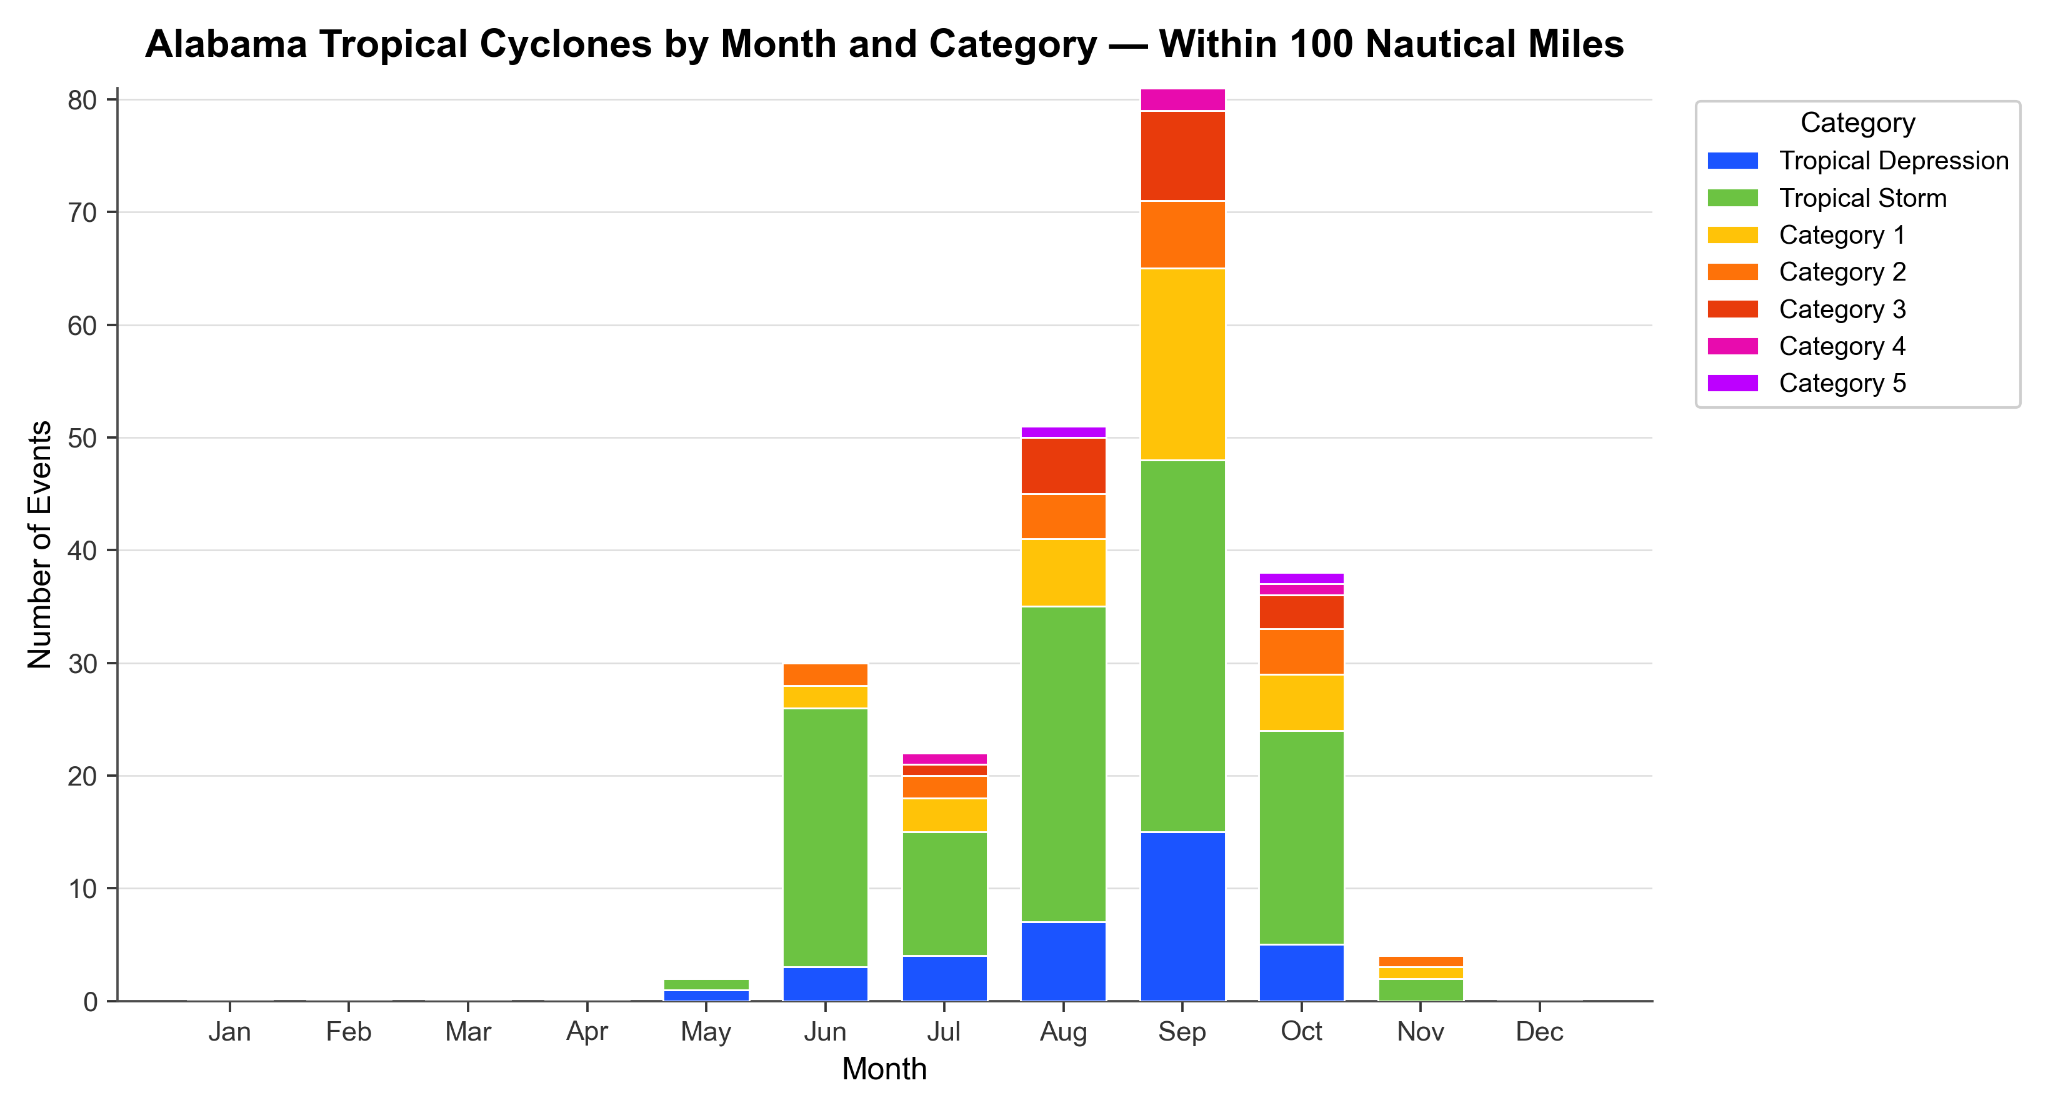
Hurricanes also have a distinct structure. The eye is the relatively calm center of the storm, surrounded by the eyewall, where the strongest winds and thunderstorms are found. Curved rainbands extend outward from the eyewall and can bring heavy rain, strong winds, and tornadoes. These impacts can extend hundreds of miles from the center of the storm.
How Do Hurricanes Form?
Hurricanes need several ingredients to develop: warm ocean water, abundant moisture, rising air, and atmospheric conditions that allow thunderstorms to organize. The process often begins with a tropical wave, or an area of low pressure moving through the warm, moist tropics.
When ocean temperatures are around 80°F (26.5°C) or warmer, warm, moist air can rise and fuel thunderstorms. As more air rises, surface pressure falls, drawing in additional warm, moist air and creating a cycle that can strengthen the storm.
The storm also needs enough rotation to organize. Earth's rotation, through the Coriolis Effect, causes air flowing toward the low-pressure center to curve and rotate. Tropical cyclones generally form several degrees away from the equator, where this effect is stronger.
Another important ingredient is relatively weak vertical wind shear, or changes in wind speed or direction with height. Strong wind shear can disrupt a developing storm by pushing thunderstorms away from the storm's center. These conditions are more likely during El Niño years, which generally makes the Atlantic environment less favorable for tropical cyclone development. La Niña tends to have the opposite effect, reducing vertical wind shear and creating a more favorable environment.
Alabama Tropical Cyclones
A total of 230 tropical cyclones with intensities of tropical depression or higher have occurred within 100 nautical miles of Alabama between 1851 and 2025. Of those, 23 were major hurricanes.
These numbers come from the Atlantic Hurricane Database (HURDAT2) best-track dataset, which contains tropical cyclone records dating back to 1851. For this analysis, we counted a storm if its track came within 100 nautical miles of Alabama's state boundary. Each storm was counted only once, even if it entered and left the area multiple times. On average any given year has 1.3 tropical cyclones that track within 100 nautical miles of Alabama. The most storms recorded in a single year was 5, and that happened in 2005 and 2021.
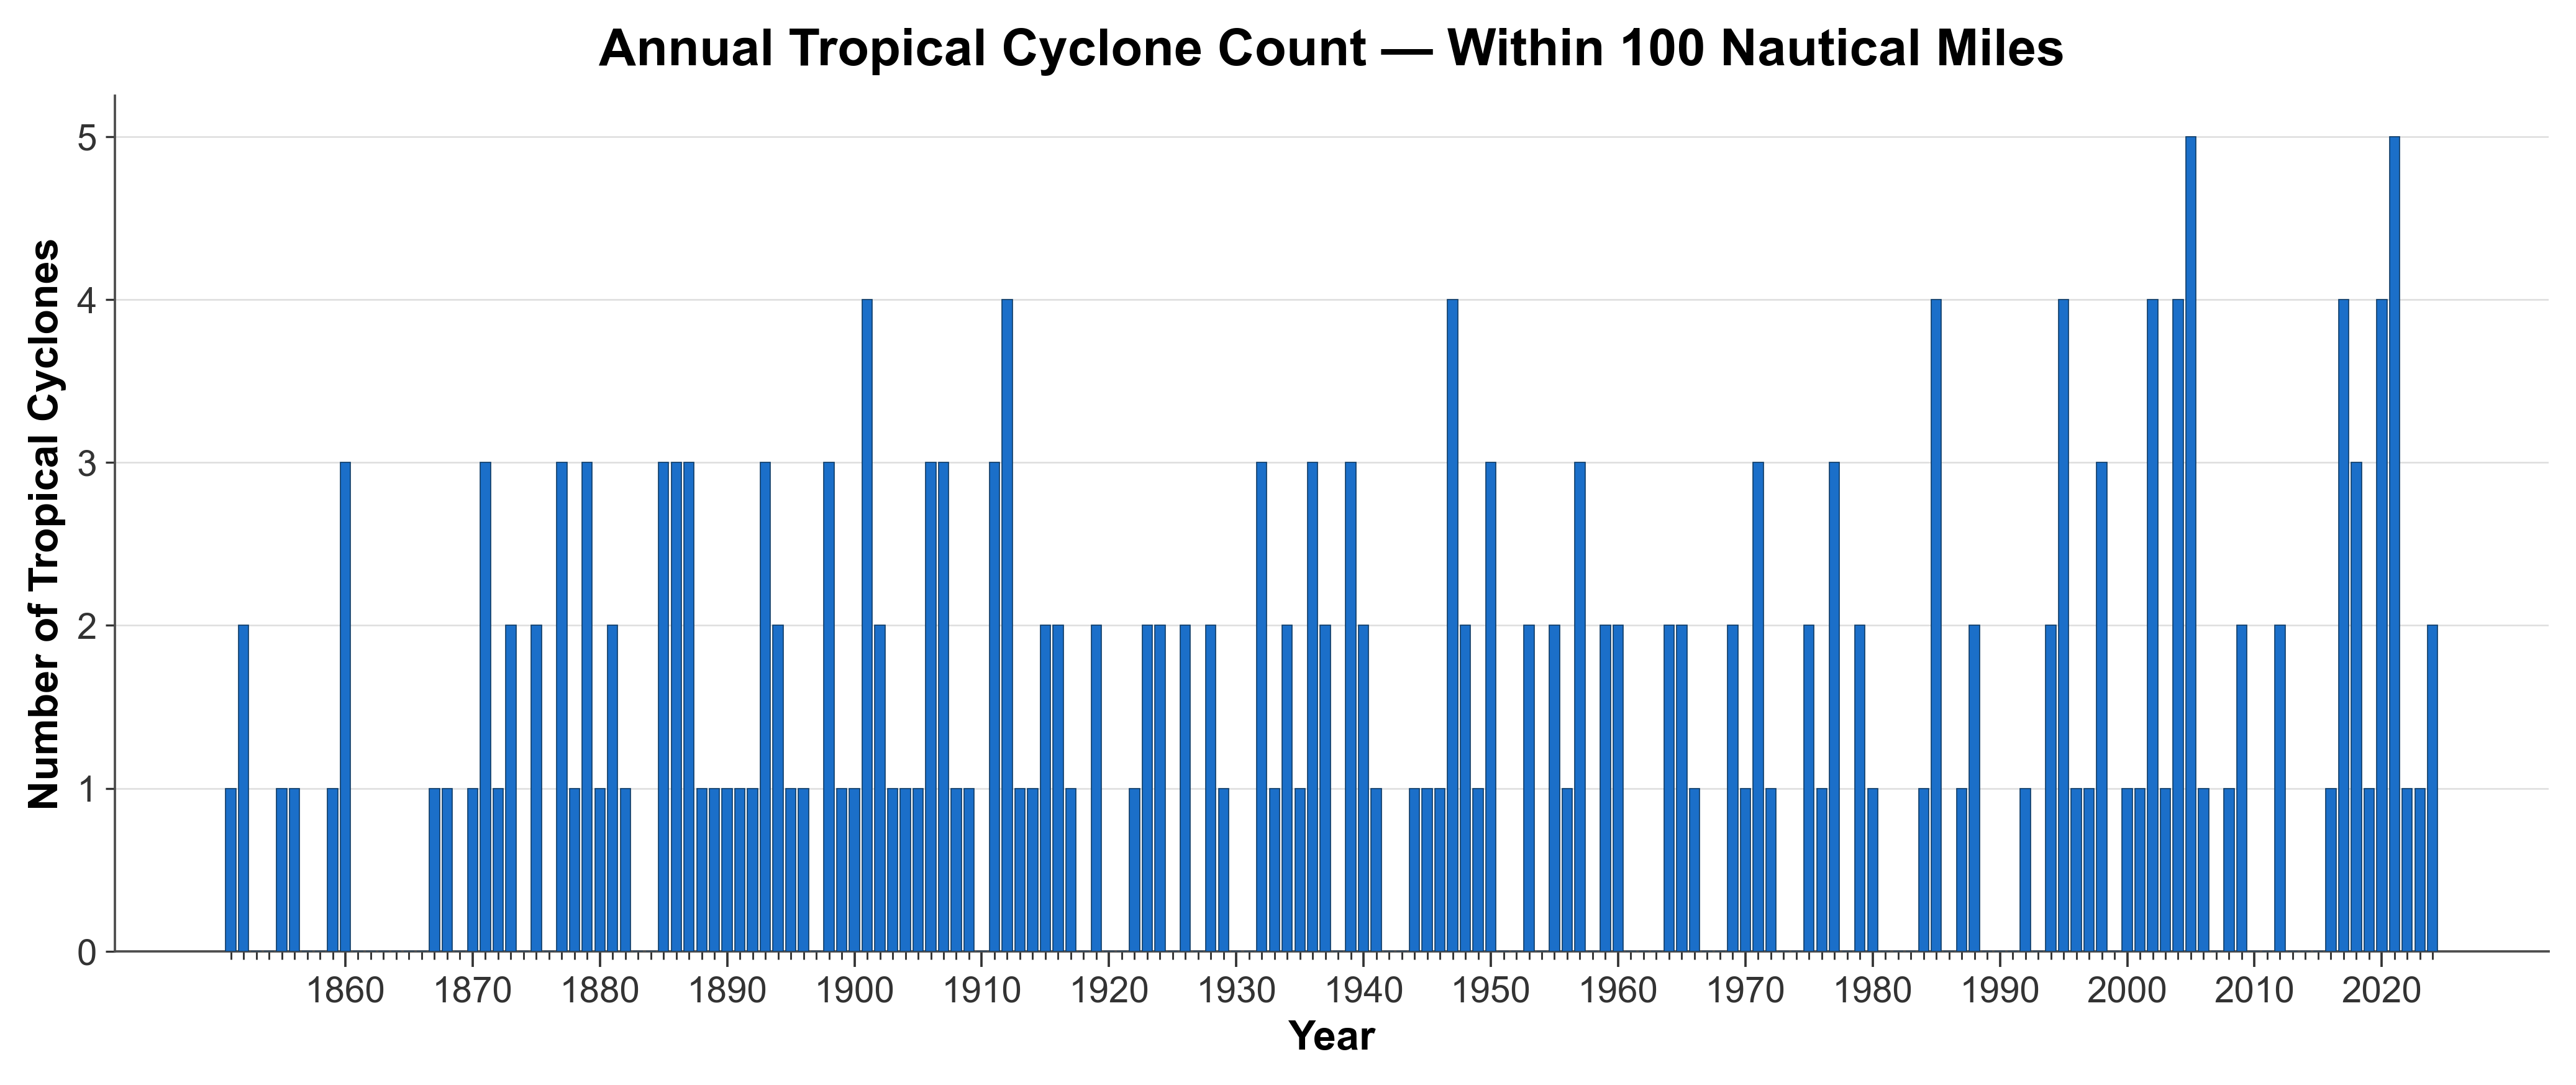
At first glance, the annual counts seem to show more frequent spikes in tropical cyclone activity since the 2000s. Does that mean Alabama is experiencing more tropical cyclones than it did in the past?
Not necessarily. Year-to-year activity can vary quite a bit, making long-term trends difficult to see. To get a clearer picture, we can smooth out those ups and downs using a 30-year running average. This gives us a better idea of how the typical level of tropical cyclone activity has changed over time.
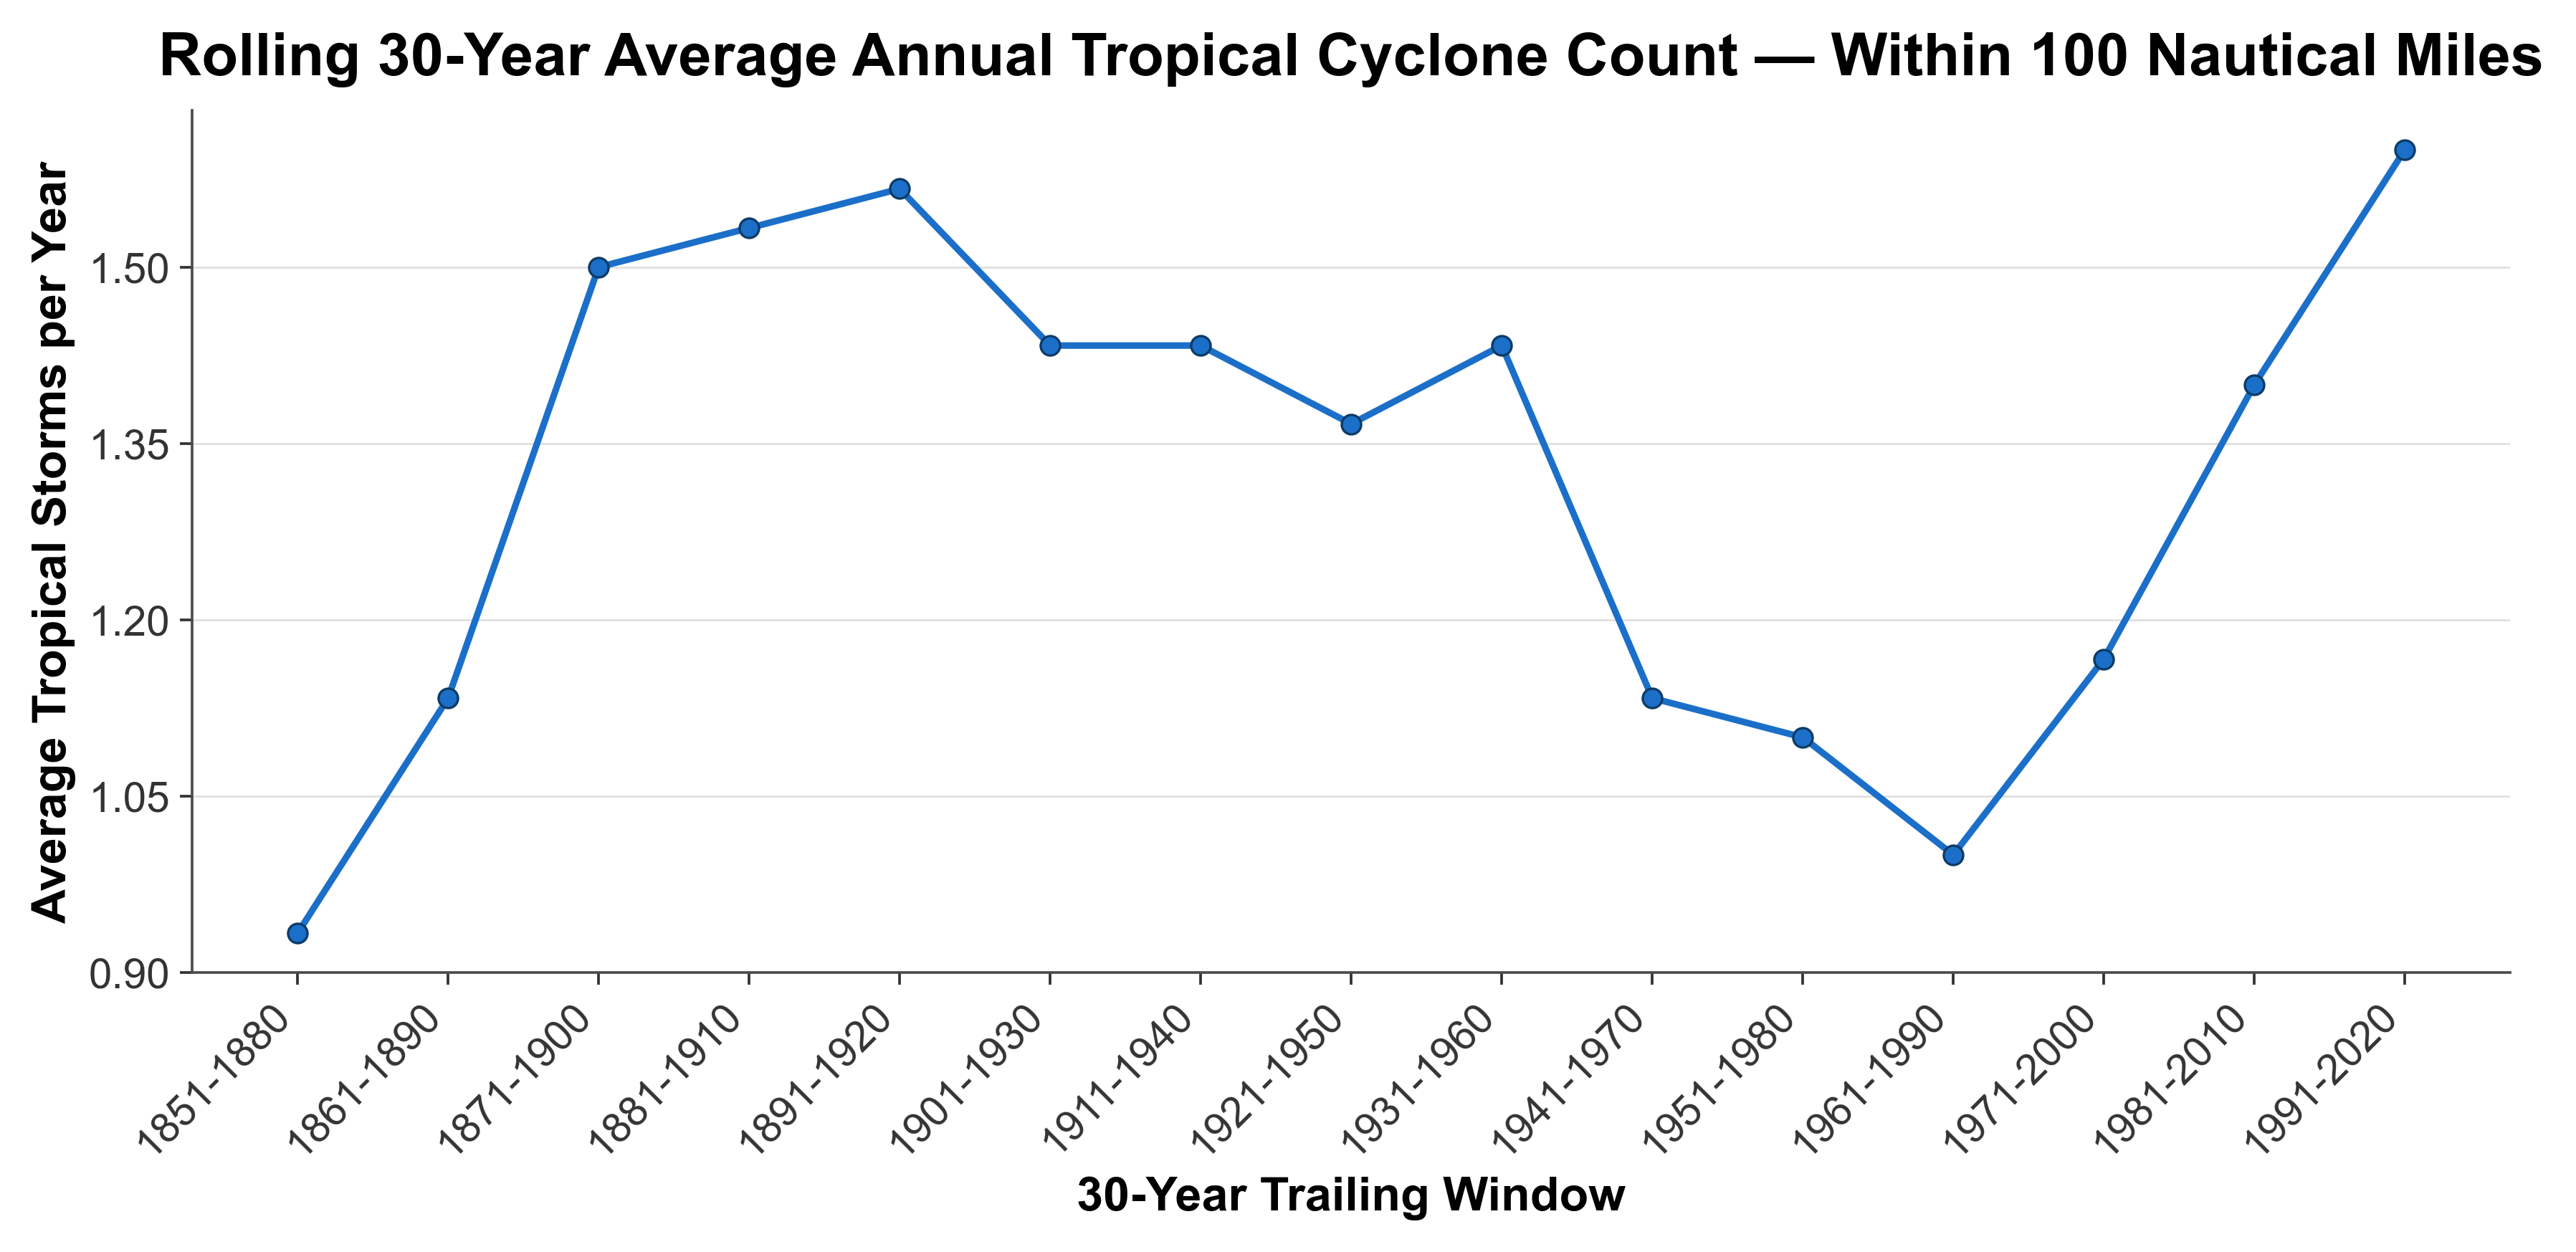
The rolling 30-year averages show how the typical level of tropical cyclone activity has changed over time, but they can also smooth out important year-to-year variability. Two periods that stand out are the 30 year averages ending in 1920 and 2020. Although these averages are roughly the same, the patterns of activity that produced them were quite different. The 30 years leading up to 1920 were characterized by generally lower and more consistent annual tropical cyclone activity (all but 4 years had at least 1 tropical cyclone). In contrast, the period leading up to 2020 included some of the highest annual counts in the record, interspersed with years that had relatively low activity. In other words, the long-term averages may be similar, but recent decades have reached that average through much greater year-to-year variability.
So, are tropical cyclones becoming more common around Alabama?
The historical record does not provide a clear answer. There is an important caveat when looking at the long-term record. We have become much better at detecting and tracking tropical cyclones over time. Ships, aircraft, radar, satellites, and other technologies have all improved our ability to observe storms, particularly those that remain over the ocean. The launch of the first Geostationary Operational Environmental Satellite (GOES-1) in 1975 marked an important improvement in our ability to continuously monitor tropical cyclones, providing a more complete and consistent record of storm activity. For this reason, the trend in annual tropical cyclone activity discussed here is limited to the satellite era (1975–2025). Even within this period, however, there is no noticeable increase in the average number of tropical cyclones tracking within 100 nautical miles of Alabama in a given year. With less than two centuries of observations and substantial changes in how storms have been detected and documented over time, it remains difficult to separate long-term changes in tropical cyclone activity from natural variability and improvements in observation.
What we can say is that tropical cyclone activity around Alabama has varied substantially over time, including several exceptionally active years in recent decades.
Does ENSO Influence Alabama Hurricane Activity?
One of the major climate patterns that can influence Atlantic hurricane activity is the El Niño-Southern Oscillation, or ENSO, which occurs in the tropical Pacific Ocean. ENSO has three phases: El Niño, La Niña, and neutral conditions.
ENSO gets a lot of attention during hurricane season, and for good reason. El Niño and La Niña can influence the large-scale atmospheric conditions that help tropical cyclones develop and strengthen. It can be tempting to look at the current ENSO phase and assume it tells us what kind of hurricane season Alabama will have. But the relationship is not that simple, especially when we look at storms affecting Alabama specifically.
El Niño generally creates less favorable conditions for Atlantic tropical cyclone development by increasing vertical wind shear over the tropical Atlantic. Stronger wind shear can disrupt developing storms and make it harder for them to organize and strengthen. La Niña generally has the opposite effect, reducing vertical wind shear and creating a more favorable environment for Atlantic tropical cyclone development.
This relationship is well documented across the Atlantic basin, but the connection between ENSO and hurricanes affecting Alabama specifically is less clear. When we look only at tropical cyclones that tracked within 100 nautical miles of Alabama during the period with available ENSO data, the dataset includes just 76 individual cyclones. The ENSO data is categorically grouped by phase and strength using the Oceanic Niño Index (ONI). The table below shows the ONI value associated with each ENSO classification and strength.
Oceanic Niño Index (ONI) Category Thresholds
| Category | El Niño ONI Range | La Niña ONI Range |
|---|---|---|
| Very Strong | ≥ +2.0 | ≤ -2.0* |
| Strong | +1.5 to +1.9 | -1.5 to -1.9 |
| Moderate | +1.0 to +1.4 | -1.0 to -1.4 |
| Weak | +0.5 to +0.9 | -0.5 to -0.9 |
| Neutral | -0.5 to +0.5 | -0.5 to +0.5 |
Source: Golden Gate Weather Services (ggweather.com/enso/oni.htm)
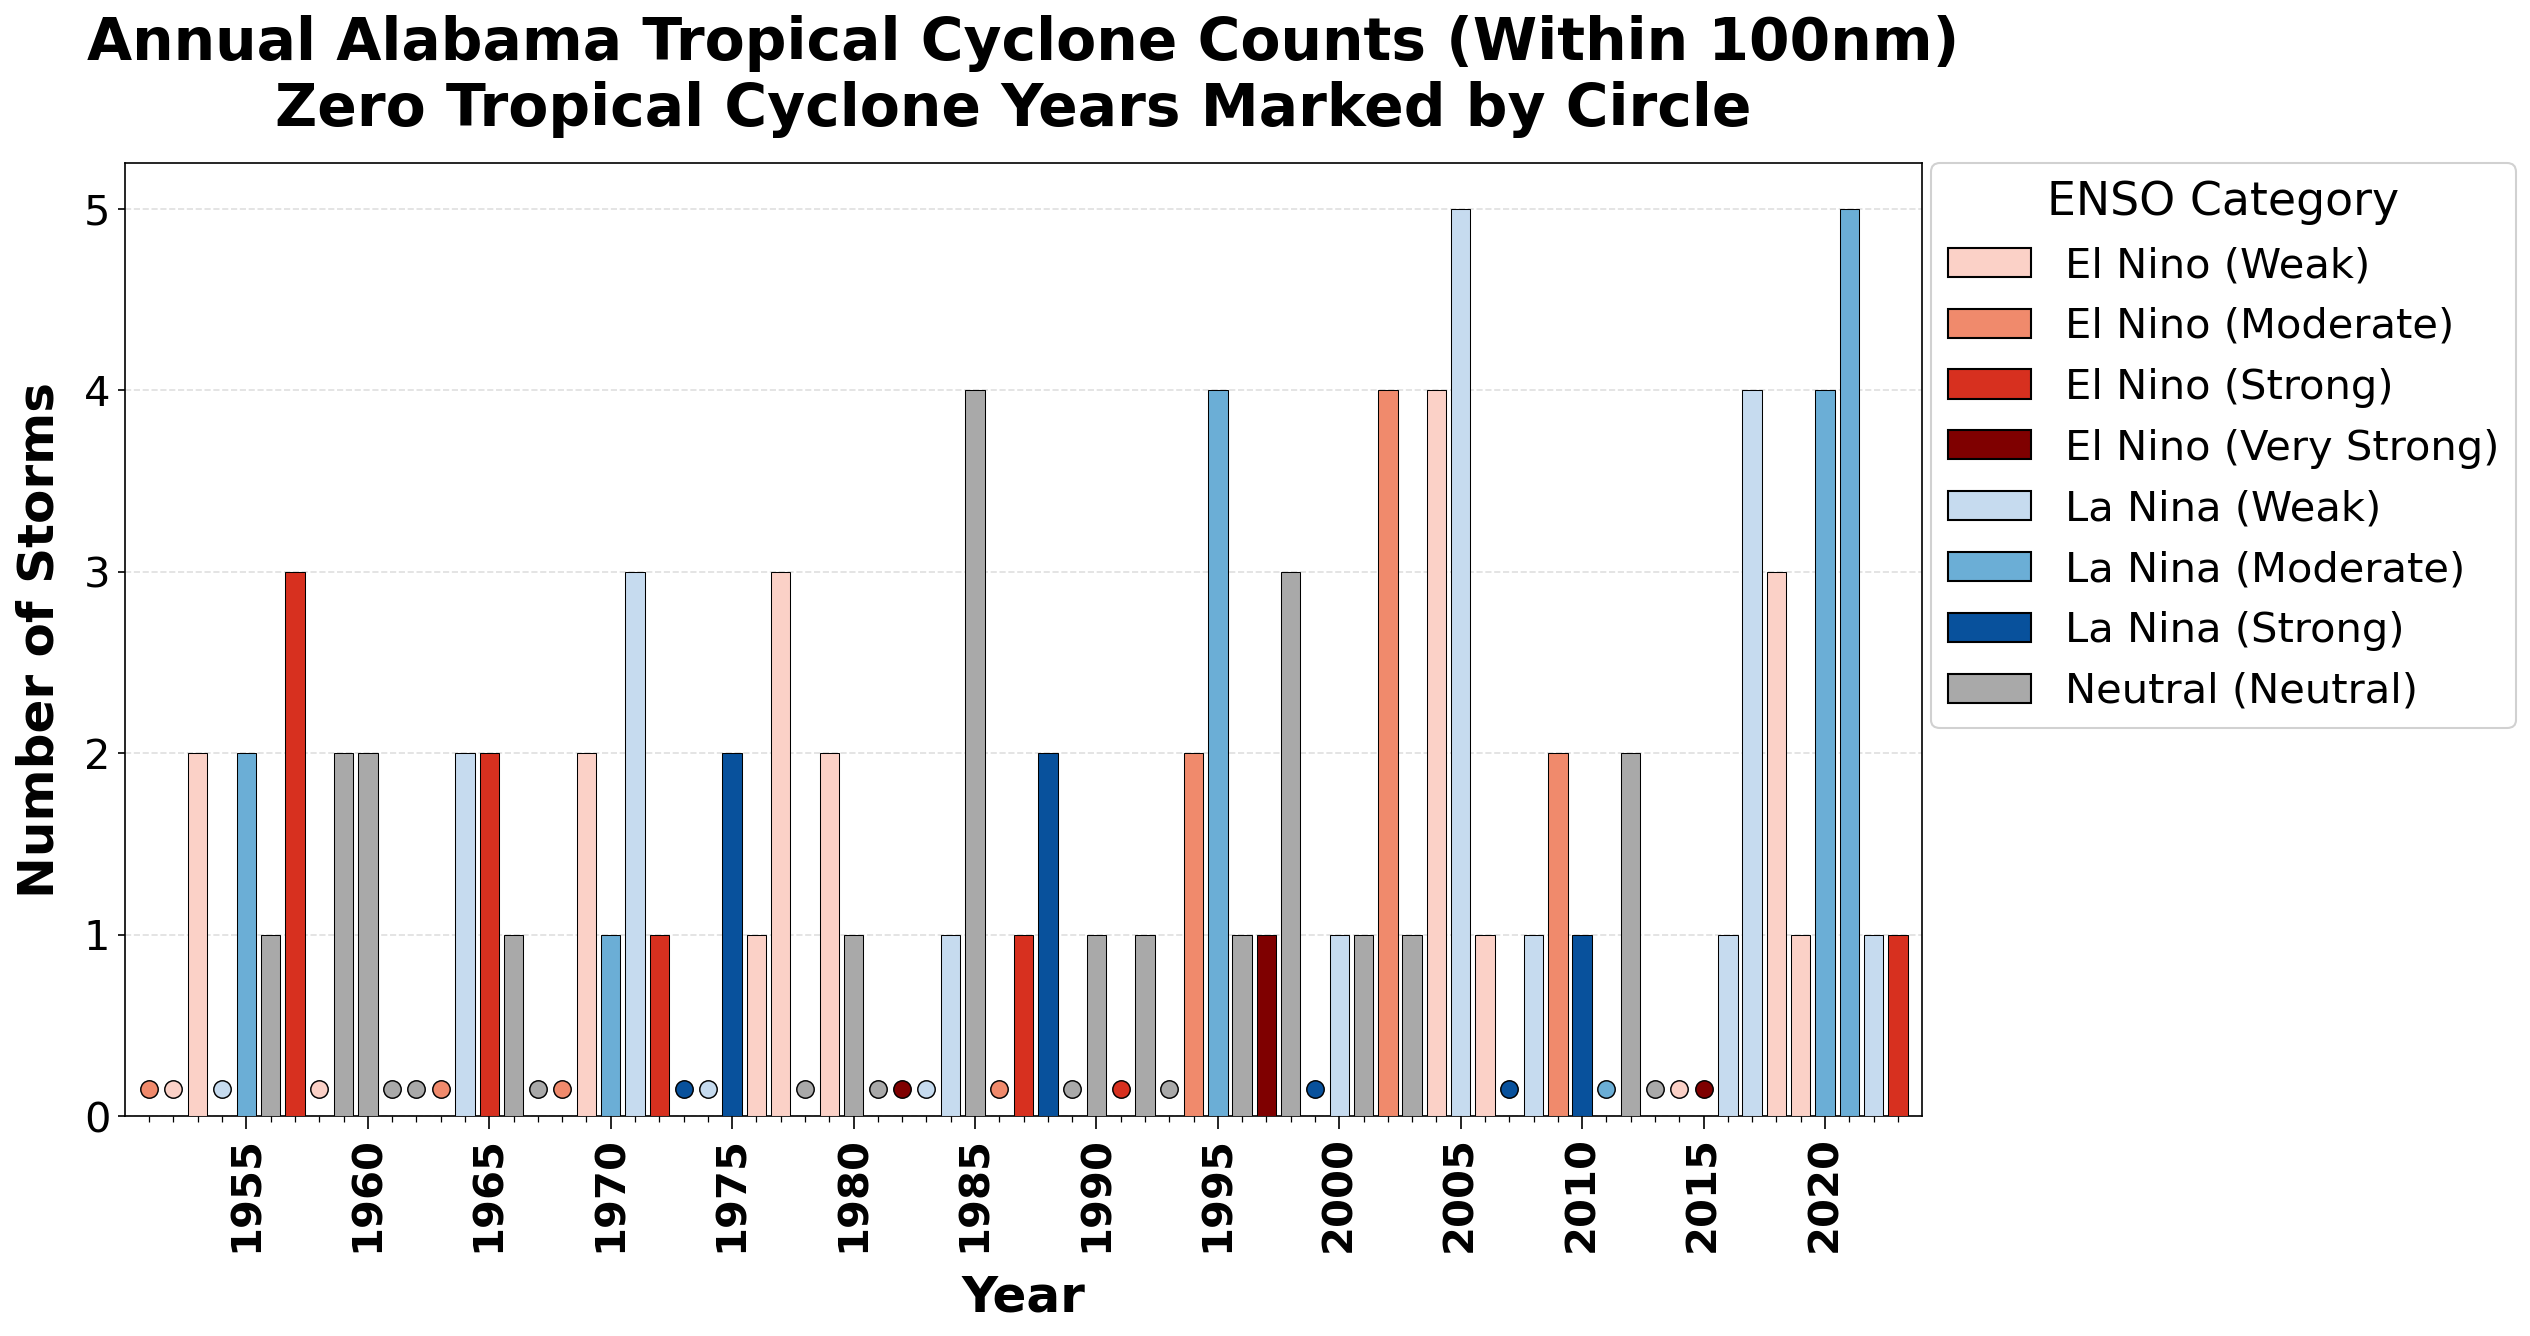
The figure below illustrates why the relationship is not straightforward. The two years with the highest number of tropical cyclones near Alabama occurred during La Niña, but many years with moderate to strong La Niña conditions had no tropical cyclones track within 100 nautical miles of the state. The same is true for El Niño. Several years with moderate to strong El Niño conditions had multiple tropical cyclones pass within 100 nautical miles of Alabama.
In other words, ENSO can influence the environment for Atlantic hurricanes, but it does not determine how many storms will affect Alabama in a given year. Tropical cyclones have occurred during all three ENSO phases, including during moderate to strong El Niño and La Niña conditions.
Significant Alabama Hurricanes
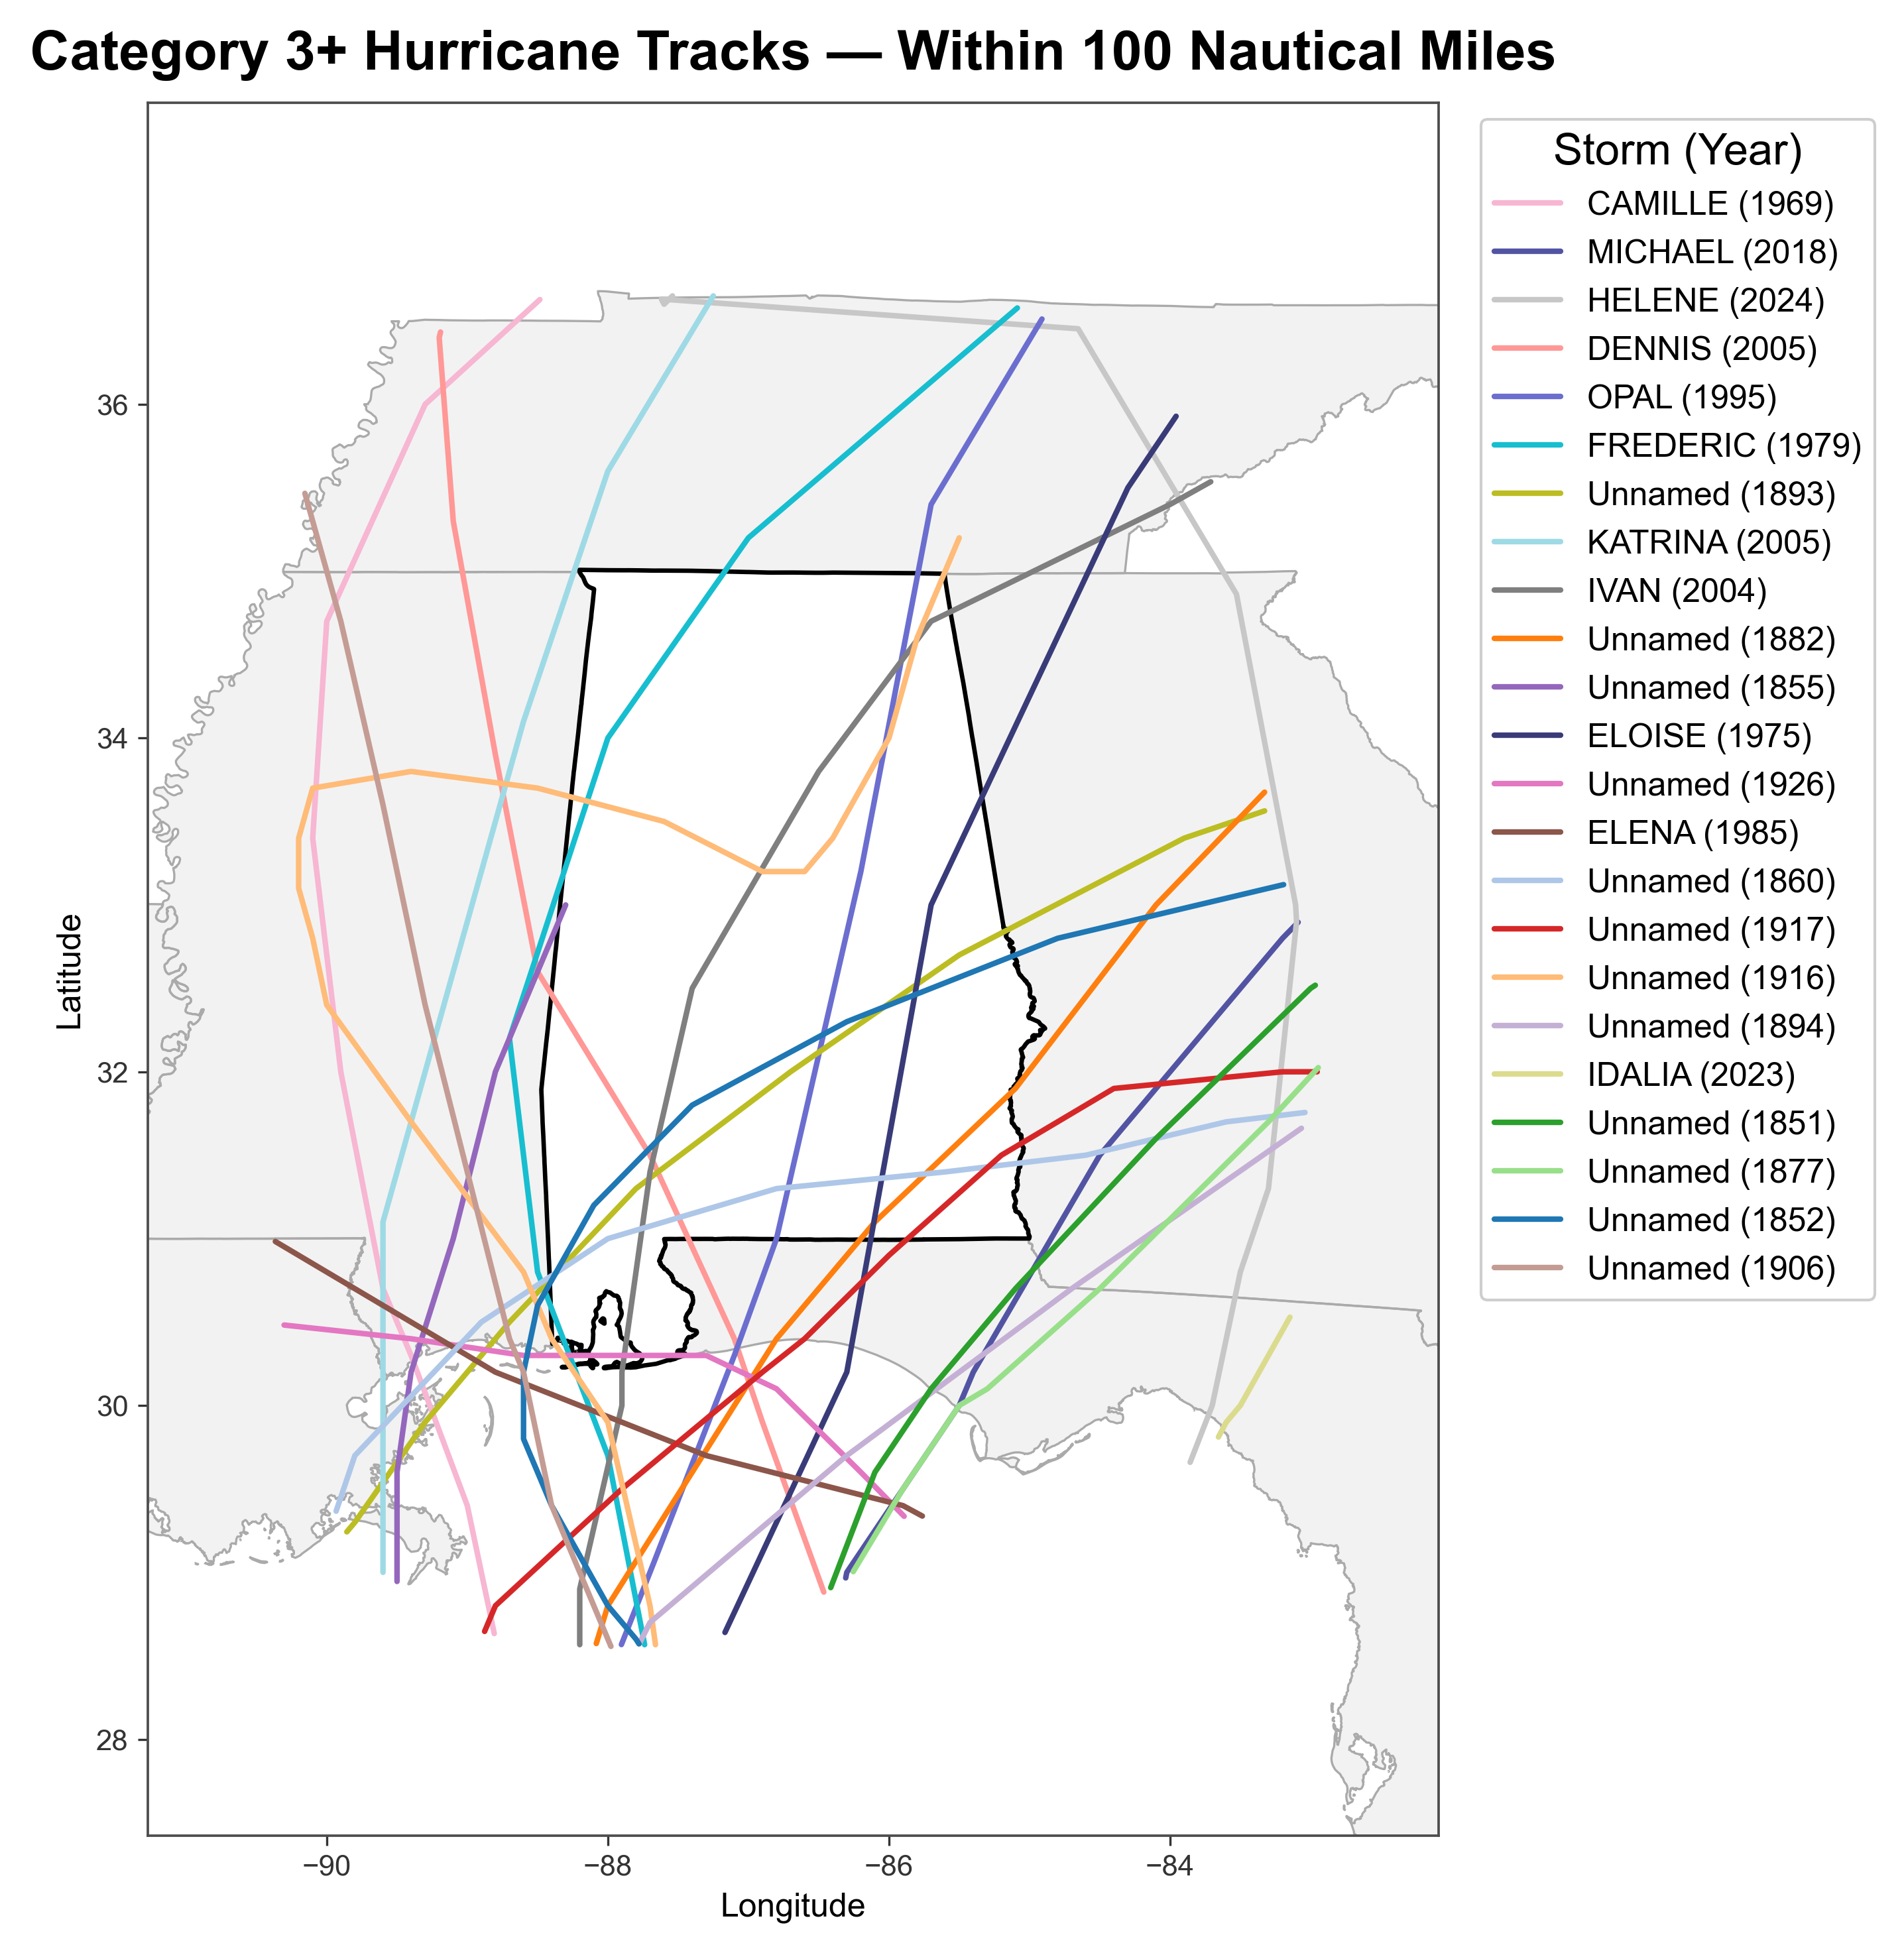
Alabama has experienced tropical cyclones of all strengths, but some storms have had a much greater impact than others. Figure 6 shows the tracks of Category 3+ hurricanes that passed within 100 nautical miles of Alabama. Some of these storms passed directly over the state, while others stayed outside Alabama's physical boundaries. A hurricane does not have to pass directly over Alabama to cause significant impacts, since storm surge, heavy rain, strong winds, and tornadoes can affect areas well beyond the storm's center.
Below are three case studies of impactful hurricanes: Hurricane Frederic, Hurricane Ivan, and the Great Miami Hurricane of 1926. These are not a comprehensive list of Alabama's most impactful hurricanes, and it’s important to note that hurricane impacts can be measured in many ways. We have chosen these three hurricanes because they had the greatest sustained wind speeds that directly tracked over Alabama.
1) Hurricane Ivan (2004)
Formation: September 2, 2004
Landfall: September 16, 2004
Dissipation: September 24, 2004
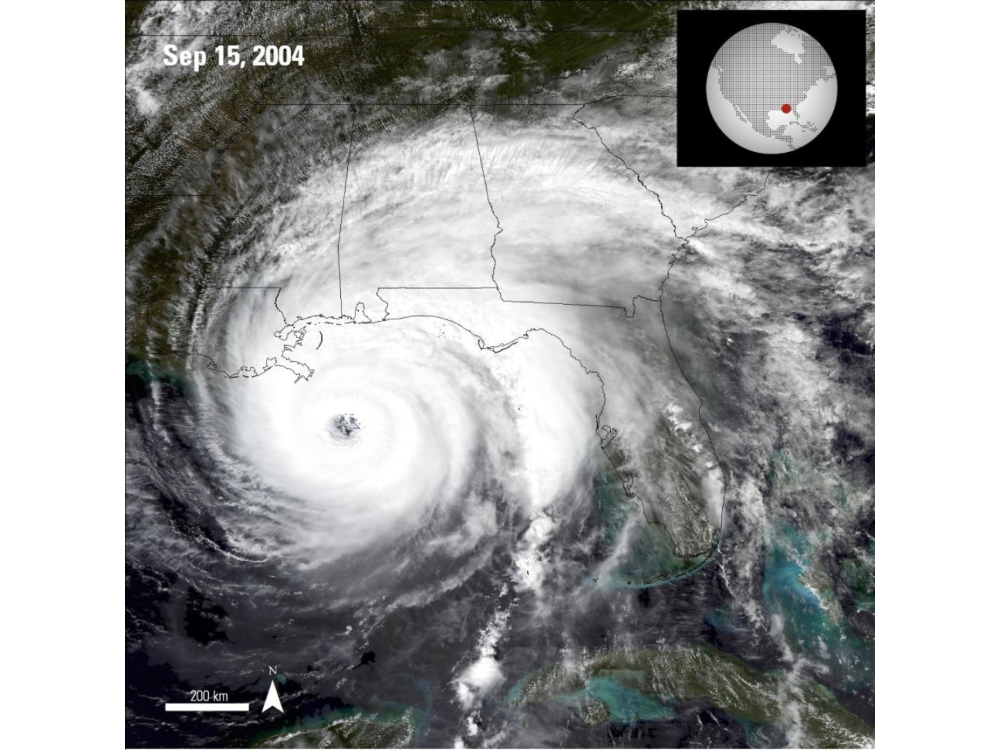
Source: NASA Earth Data
Impacts
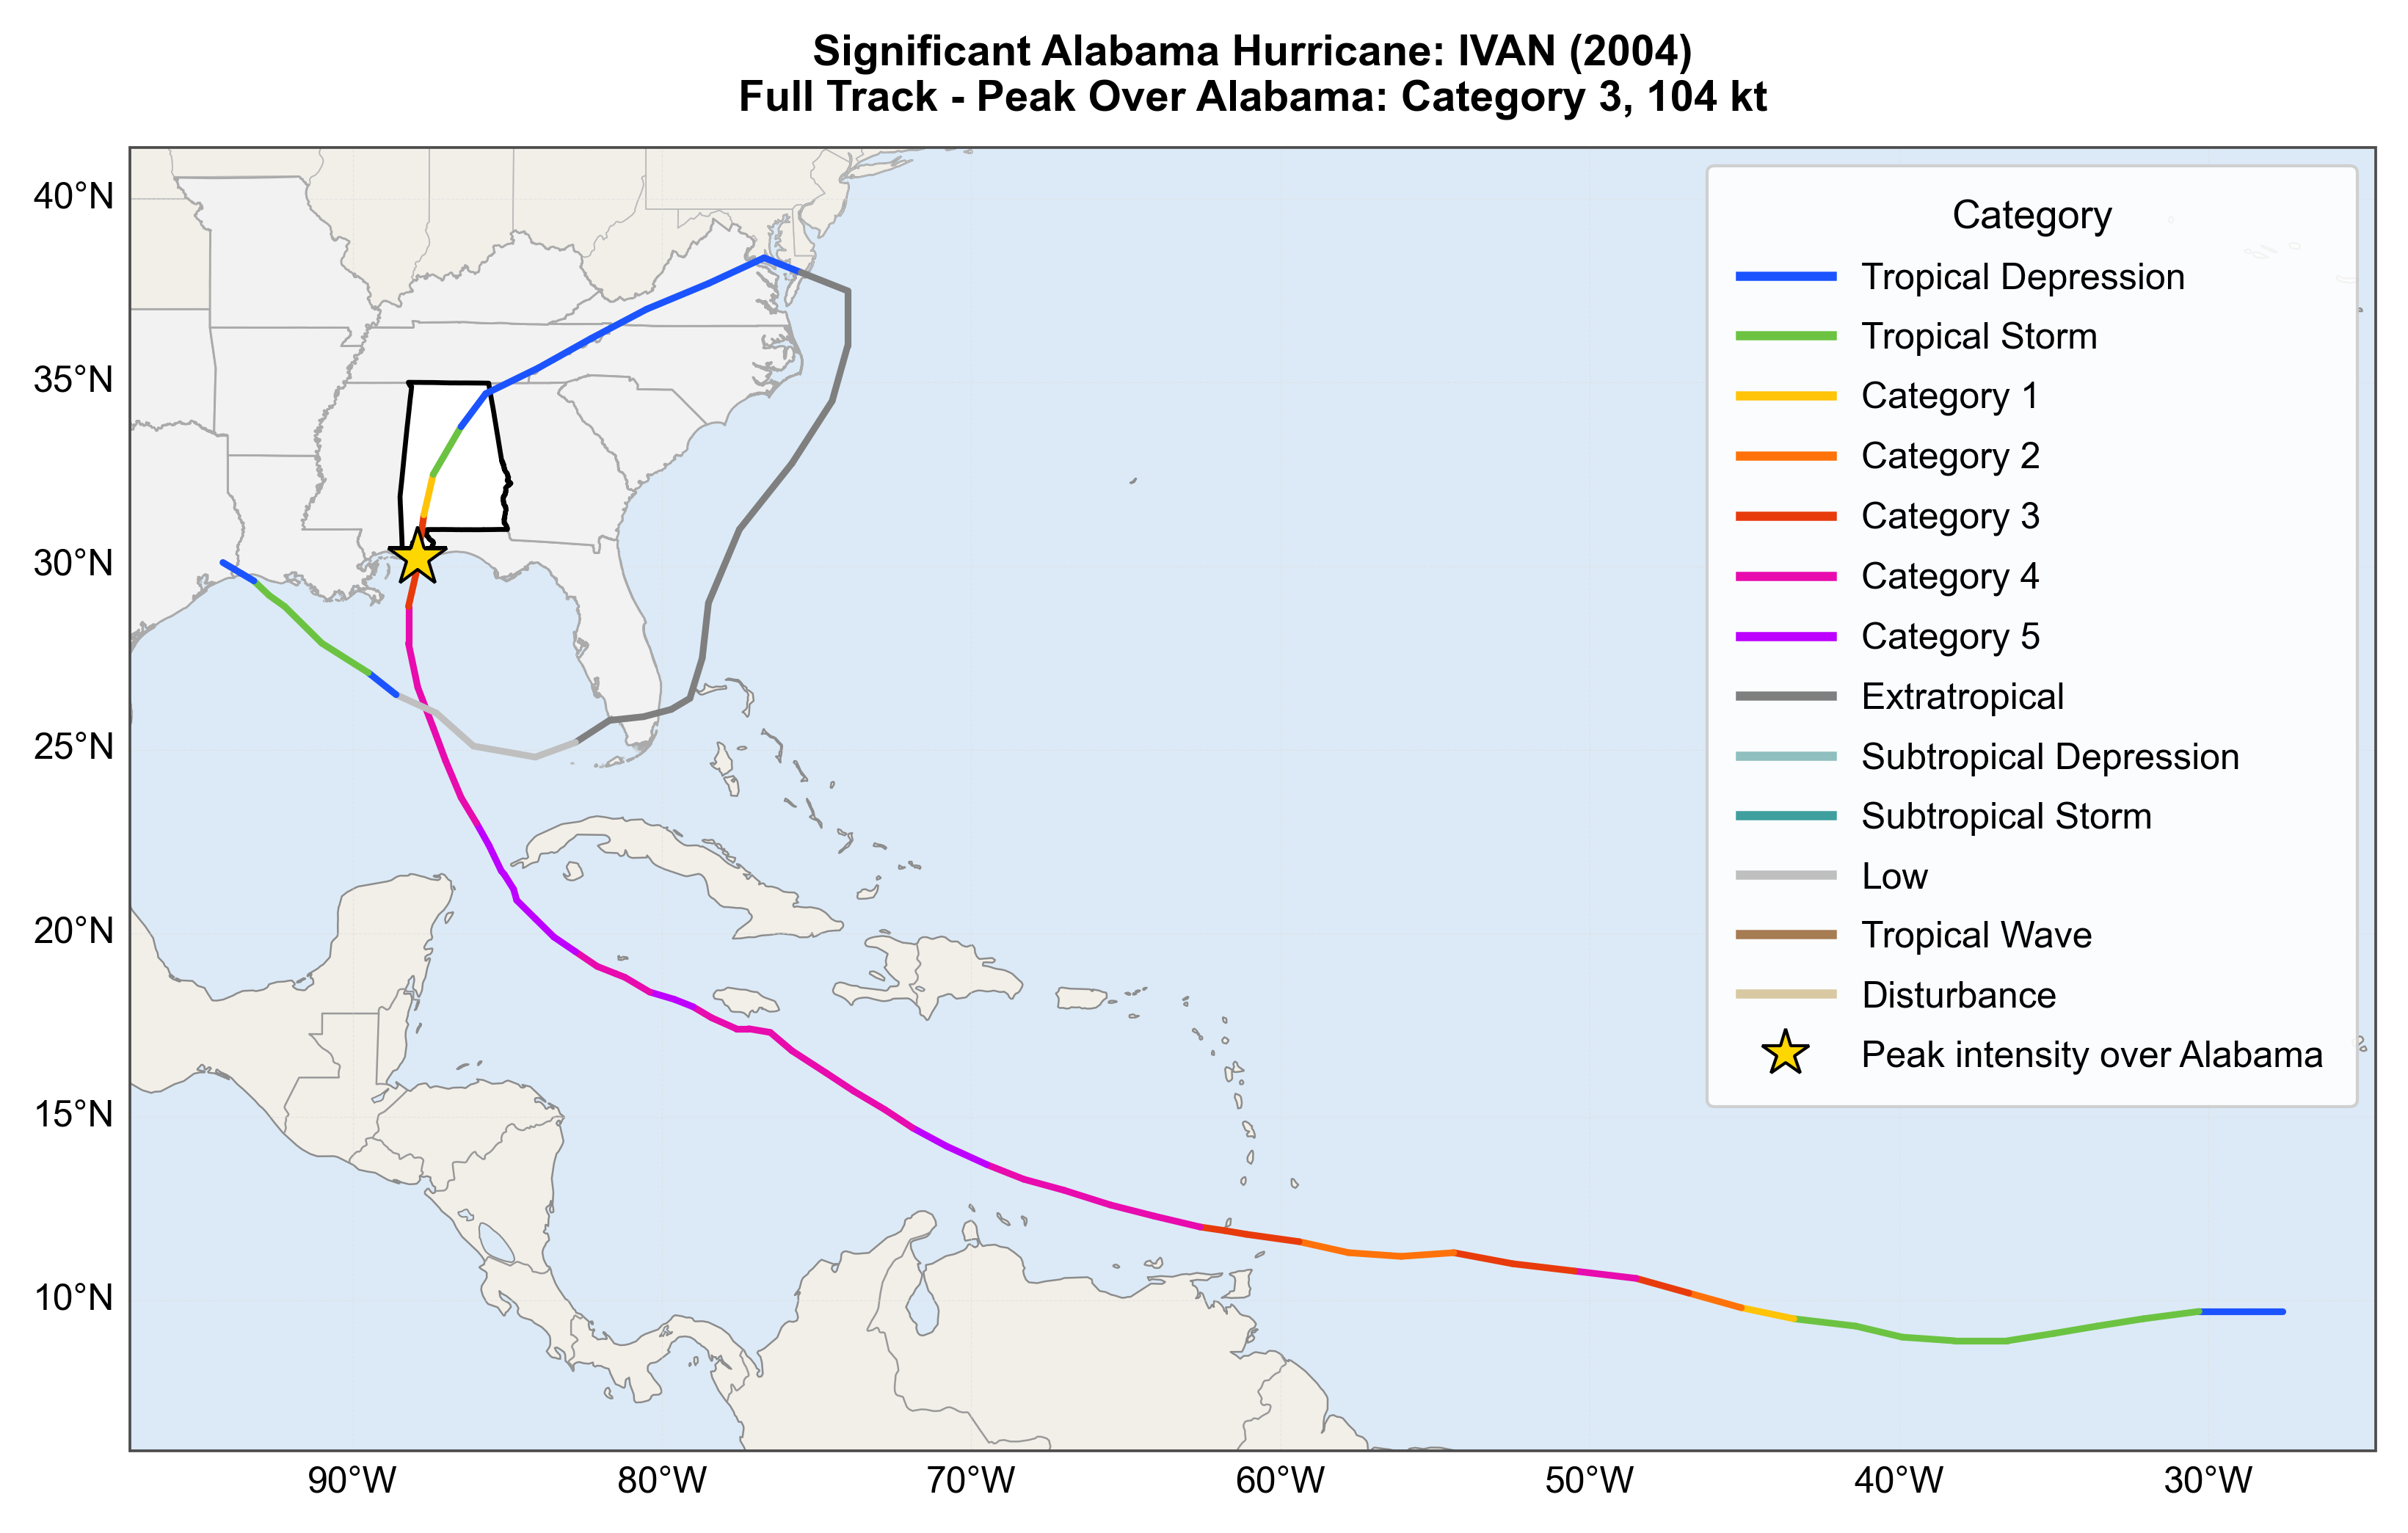
Hurricane Ivan made landfall as a Category 3 just west of Gulf Shores, AL, and reduced to a tropical depression over northeast Alabama. The system produced its strongest sustained winds of 121 mph over Pine Beach, AL, with official maximum wind gust reports of 107 mph about 33 miles away over Naval Air Station Pensacola in Florida. Roughly 15 miles away, an unofficial report from a sailboat anchored in Wolf Bay, AL recorded maximum gusts of 145 mph.
Ivan produced many tornadoes across the Southeast US, 8 of which were located in Alabama. The system produced a 10–15 ft storm surge along the Alabama/Florida coast. Additionally, high surf and wind caused extensive damage. Despite this, no fatalities occurred in Alabama as a result of Ivan.
2) Hurricane Frederic (1979)
Formation: August 29, 1979
Landfall: September 12, 1979
Dissipation: September 15, 1979
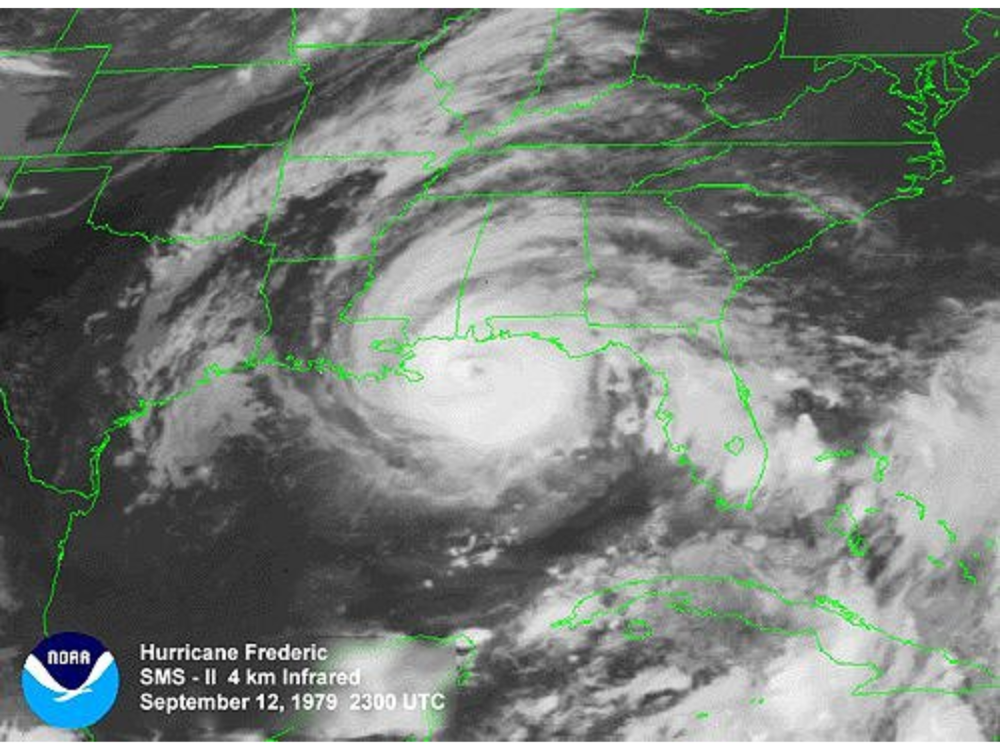
Caption: NOAA SMS-II Infrared image of Hurricane Frederic
Source: NOAA NWS
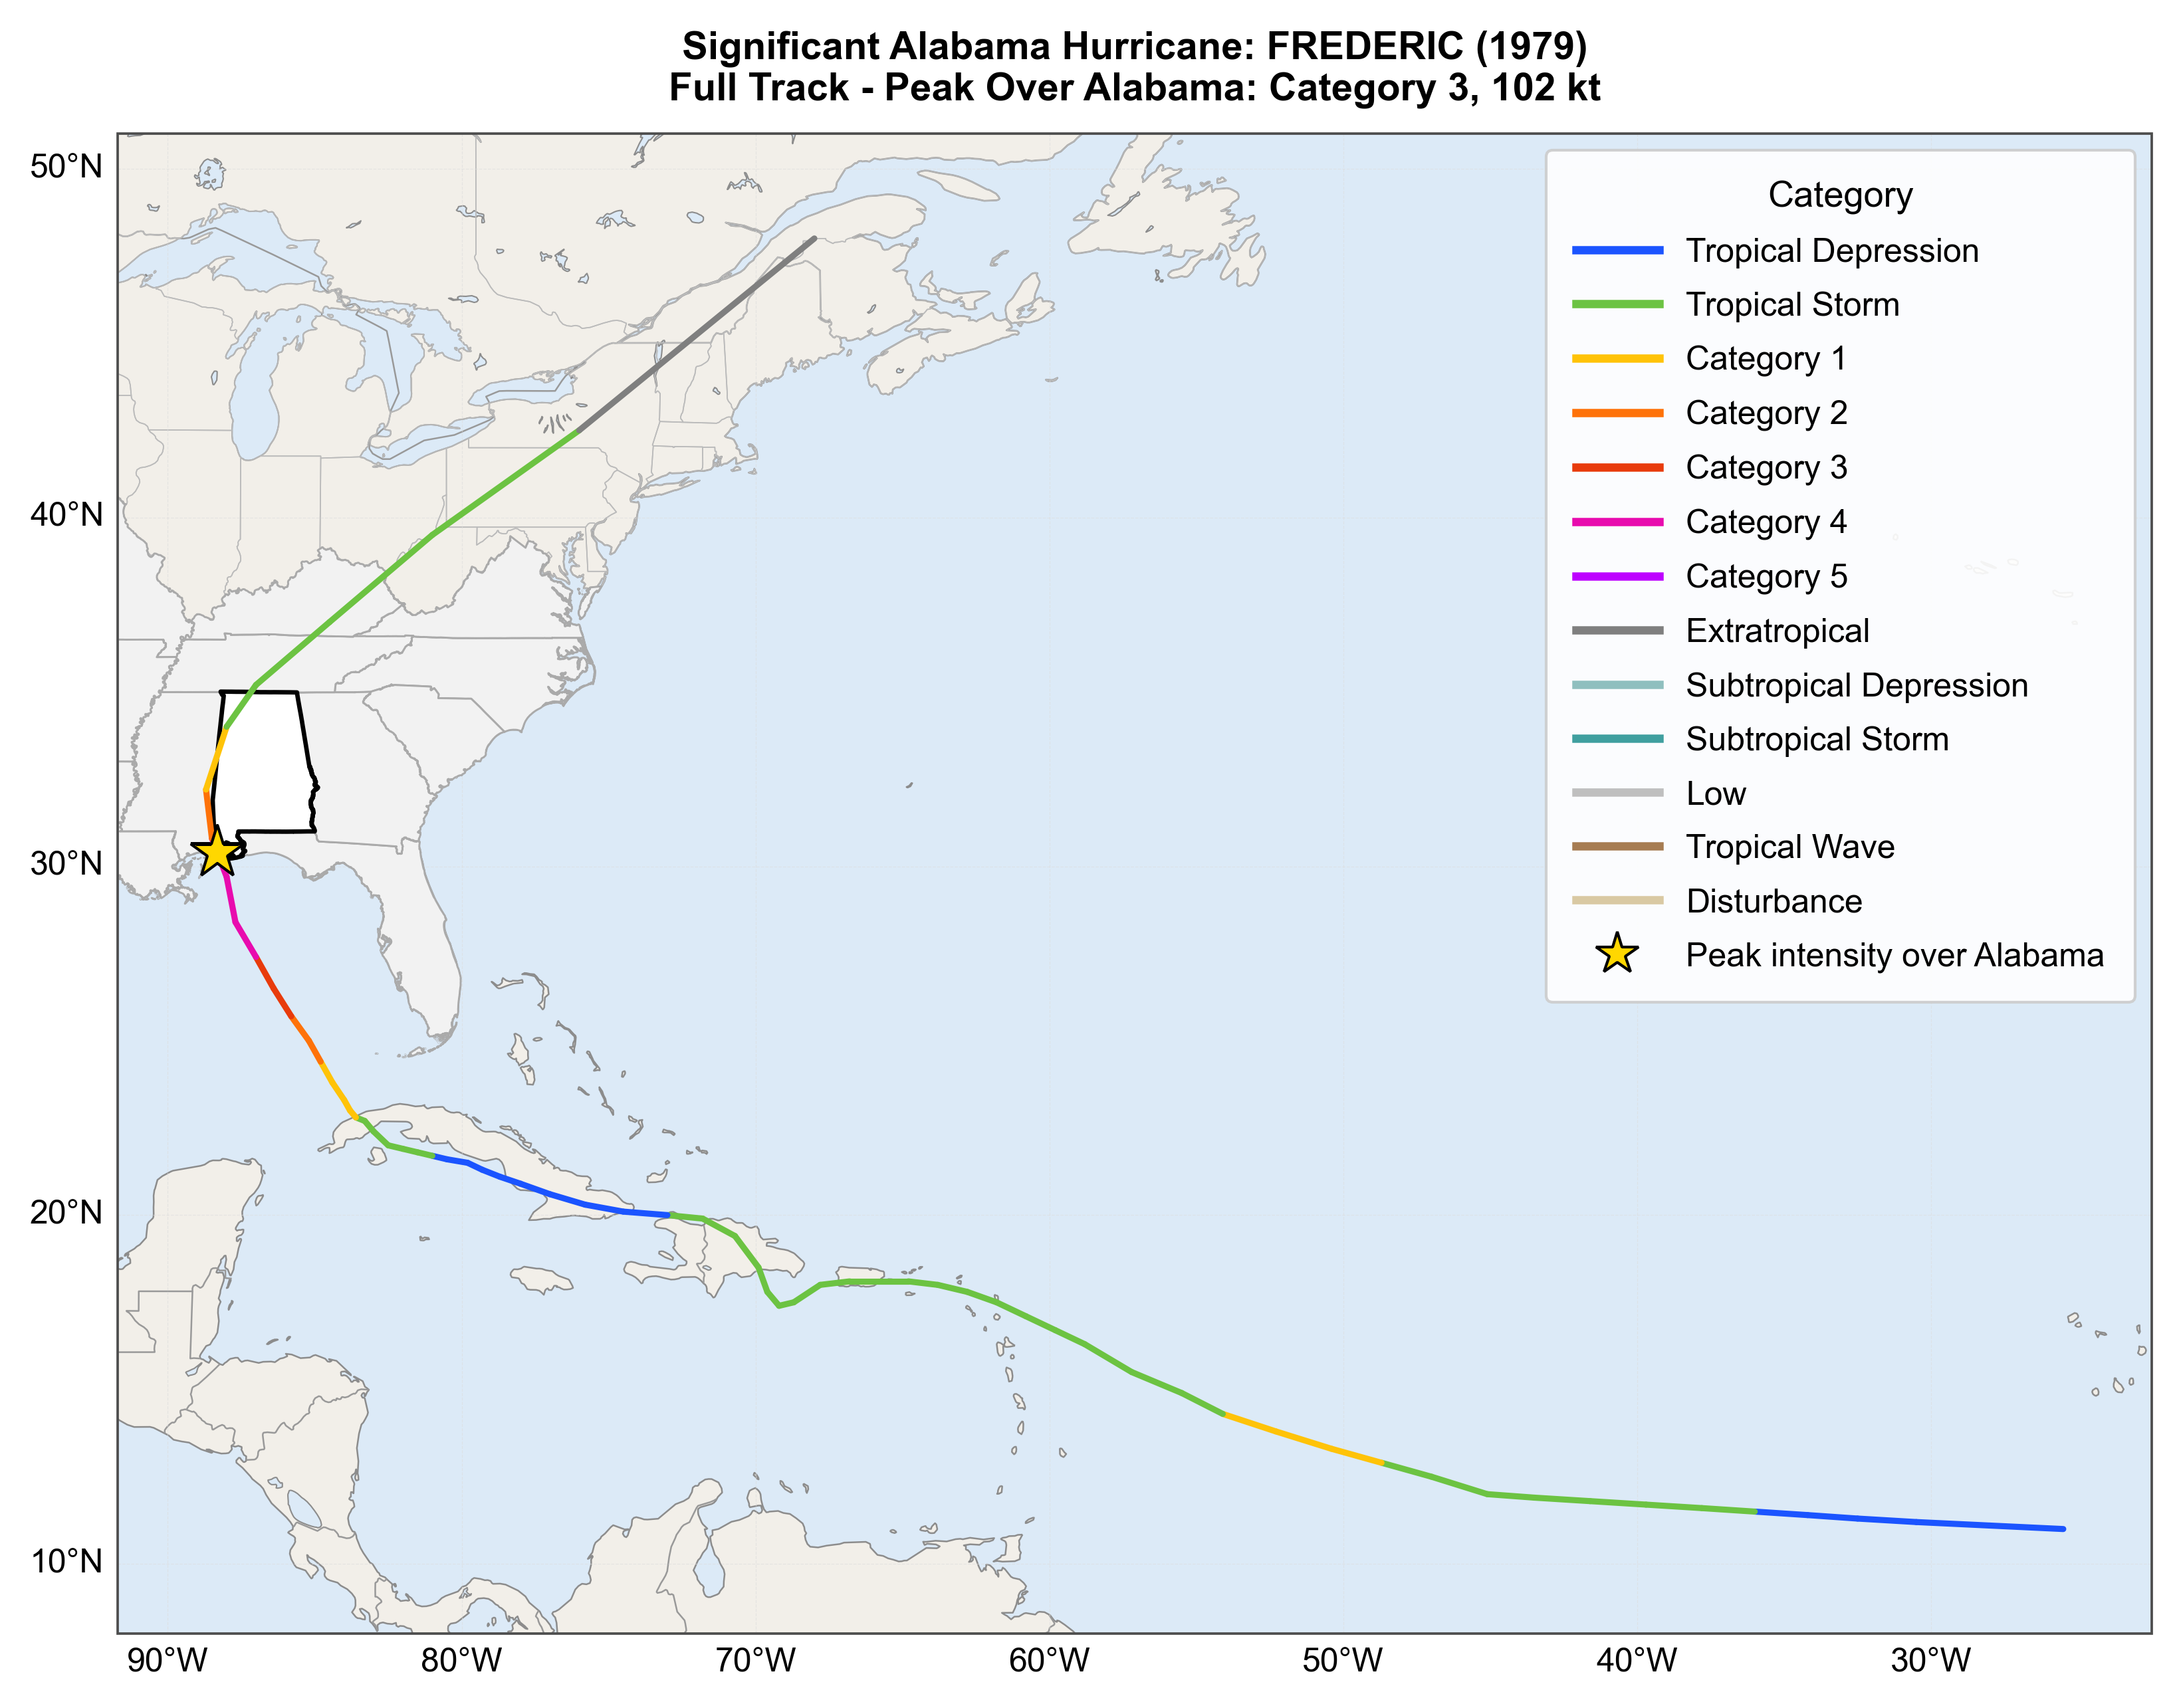
Caption: Track of Hurricane Frederic
Impacts
Hurricane Frederic made landfall as a Category 4 in Dauphin Island, AL and reduced to a tropical storm over northwest Alabama. The system produced maximum gusts of 145 mph observed at the Dauphin Island Bridge and destroyed equipment roughly three miles southeast at the Dauphin Island Sea Lab.
The Mobile Bay area experienced high winds throughout the night of September 12 and into the early morning hours of September 13. The system produced storm surges of 8-10 ft along northern Mobile Bay and destroyed numerous coastal homes and businesses. Frederic was responsible for five total fatalities near the Alabama-Mississippi border.
3) "The Great Miami Hurricane" (1926)
First Observation: September 11, 1926
Landfall: September 20, 1926
Dissipation: September 22, 1926
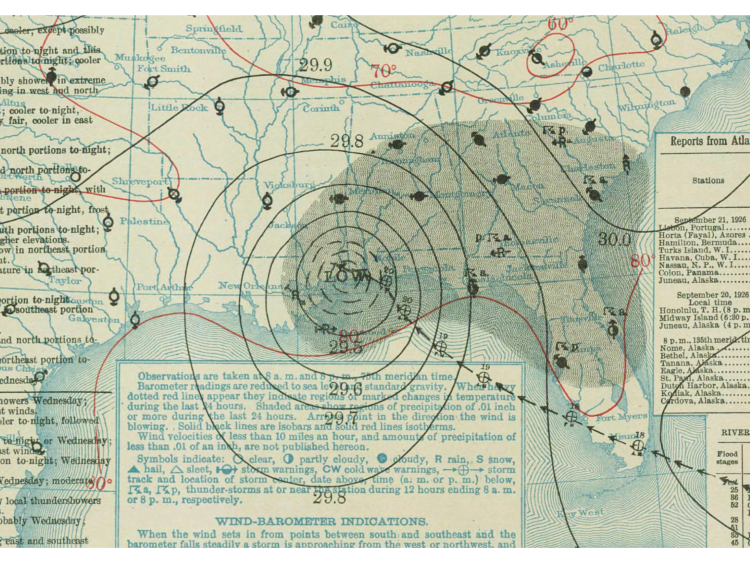
Caption: Surface analysis map of the 1926 hurricane making landfall on the border of Alabama and Mississippi
Source: NOAA Library
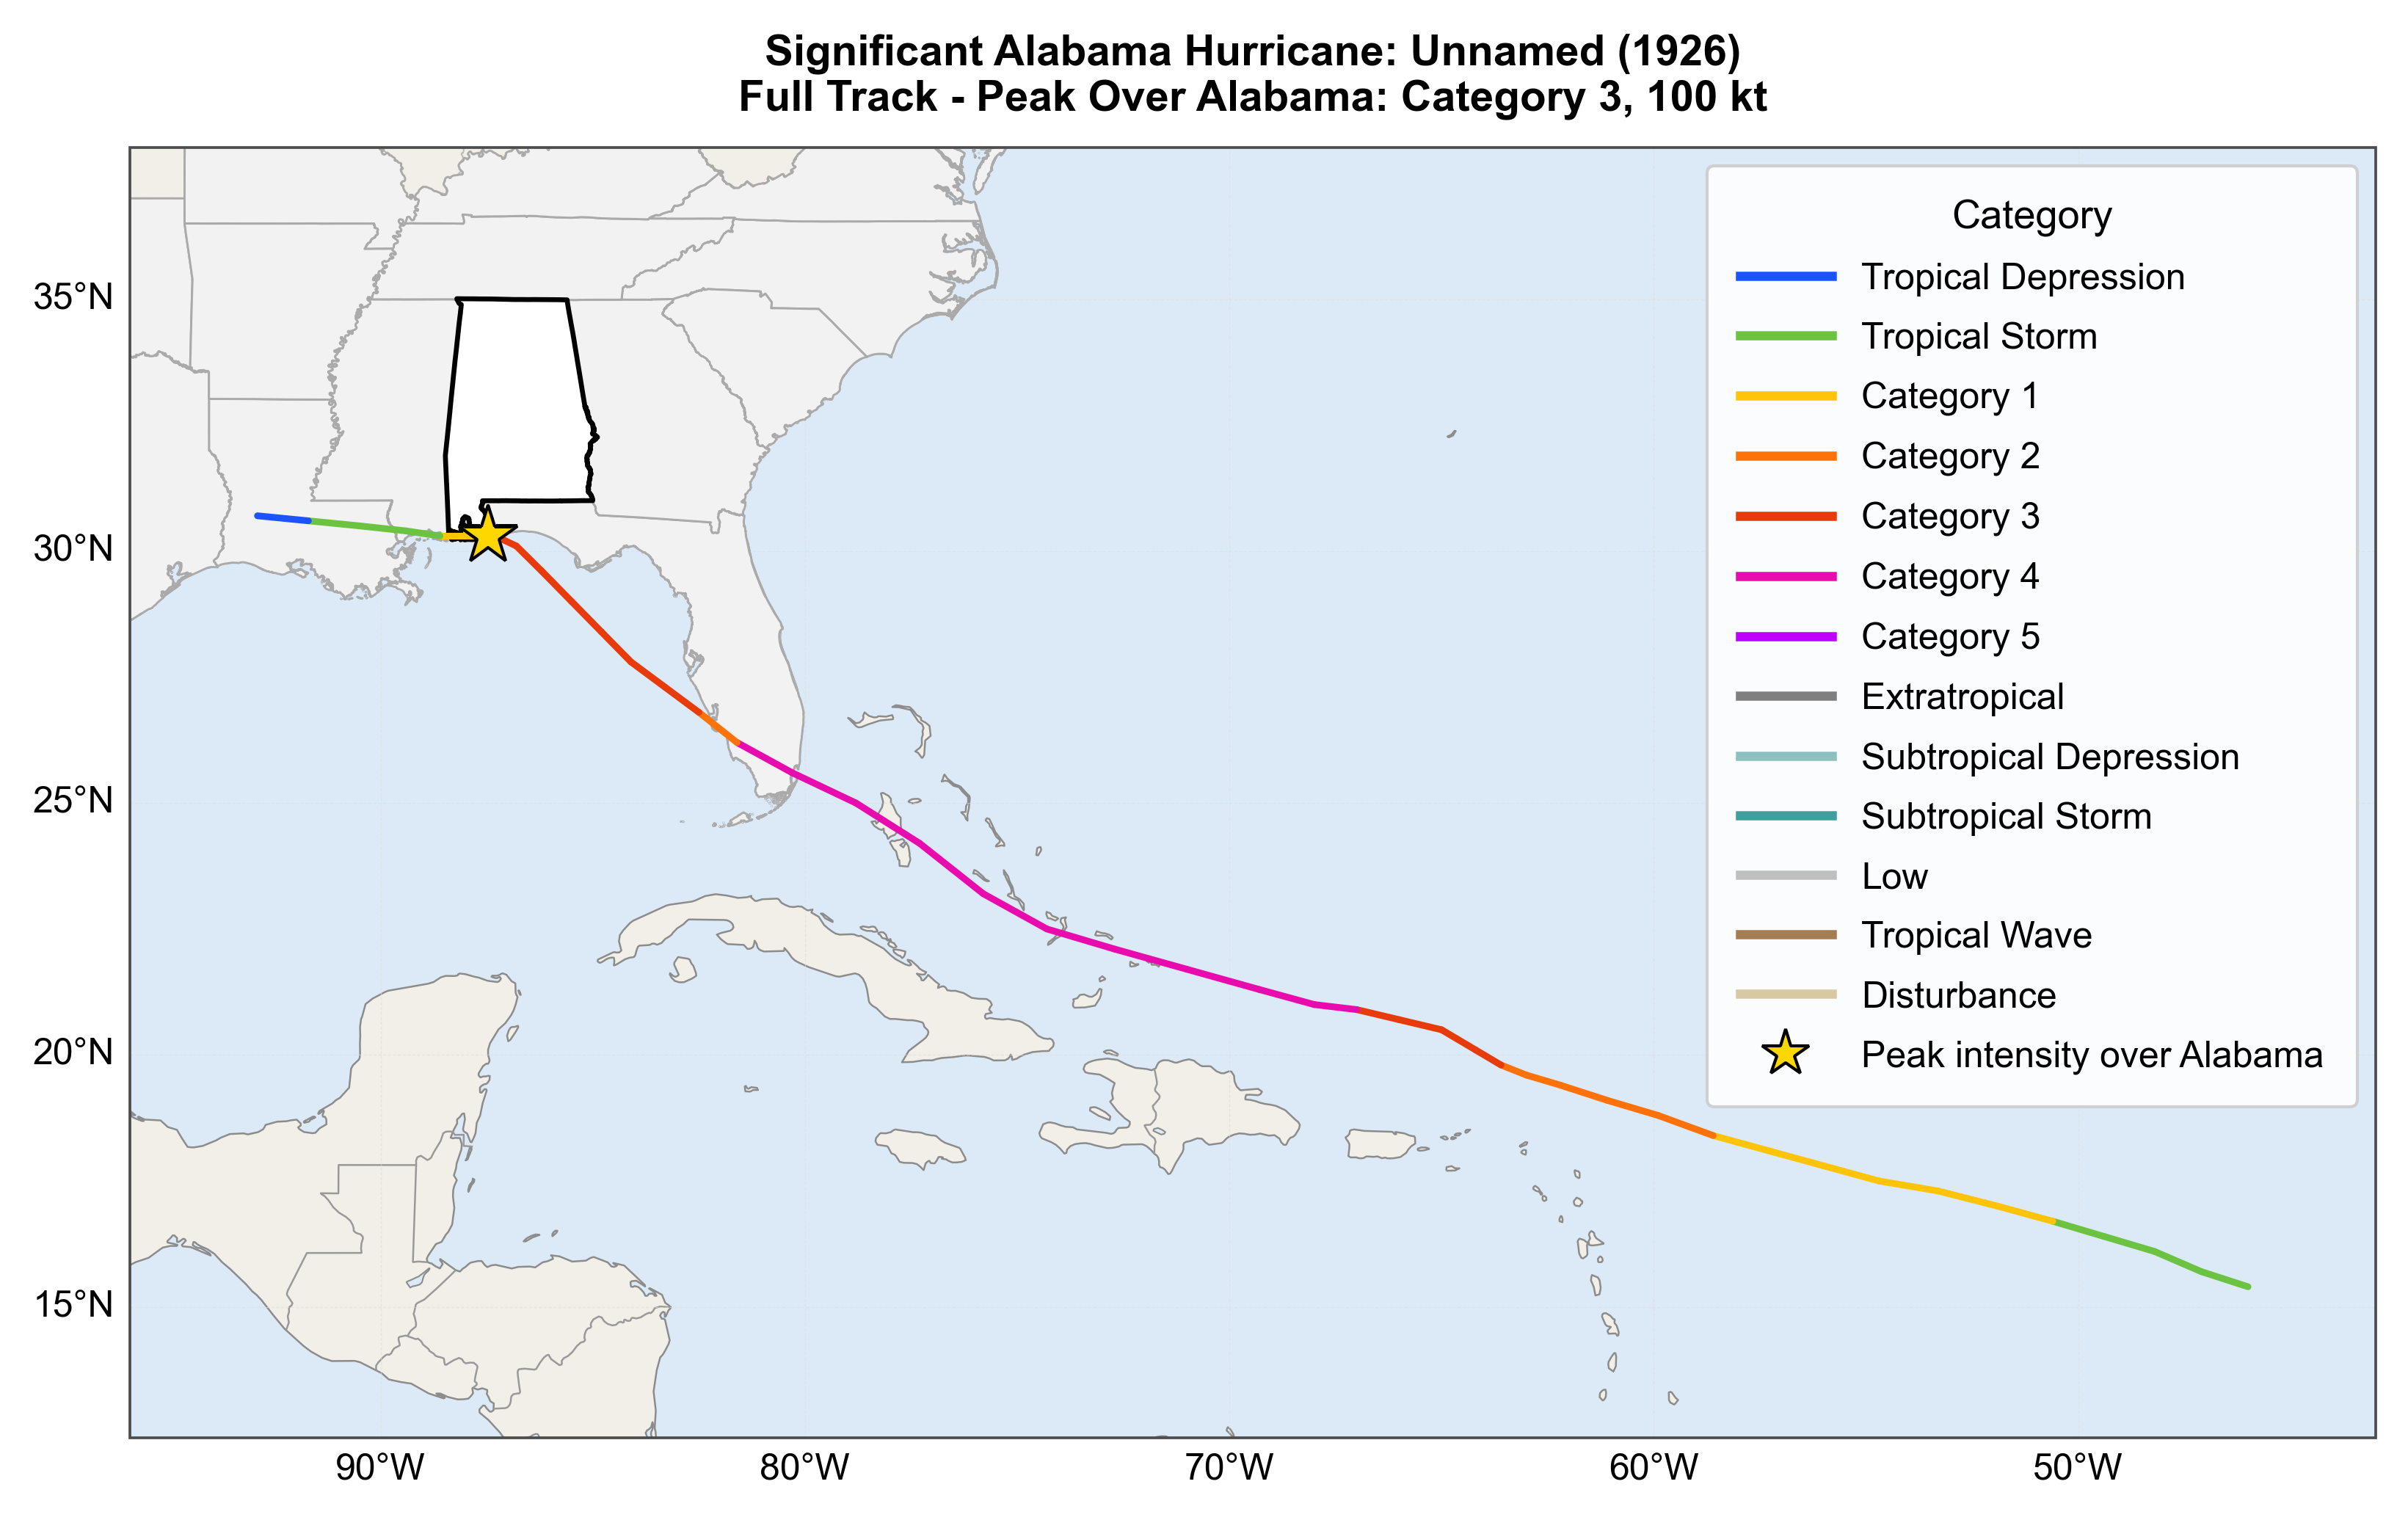
Caption: Track of the 1926 Hurricane
Impacts
Though officially unnamed, this 1926 hurricane is frequently dubbed “The Great Miami Hurricane,” no doubt due to the intensity of the storm when it made landfall in Miami, FL. Despite being considerably weaker, this system had significant impacts on Alabama when it made landfall for a second time in Pensacola, FL as a low-end Category 3. The system produced a maximum sustained wind speed of 116 mph at landfall, roughly 13 miles outside of Alabama state lines.
With upwards of 18.5 inches of rainfall in southern Alabama, this system would produce a storm surge of roughly 5 ft along the Mobile River. As a result, flooding became a major issue in conjunction with damage from high winds.
Hurricane Safety
Hurricanes can be dangerous, but knowing what to do before a storm arrives can make a big difference. Alabama Public Health has a good set of guidelines for emergency plans in Alabama, and NOAA has several resources for hurricane preparedness. In general, make sure to keep up with the hurricane forecasts to stay aware of risks coming your way, have resources and supplies available for disasters, have an evacuation plan, and protect your home if possible. Hurricanes are formidable disasters, but we can be prepared should we ever face one.