Written by: Aurora Wornham
Technical Expertise from: Dr. Rob Junod, Dr. Lee Ellenburg, & Brianne Minton
What signifies an Alabama summer to you? The steady hum of cicadas, frogs chirping after dark, fireflies dancing across the yard, or afternoon thunderstorms rolling overhead? Maybe it's the warmth that lingers long after sunset or the humidity that fogs up your glasses the moment you step outside. These are all familiar signs of summer in Alabama, but the season isn't experienced the same way everywhere. From the cooler mountains of northeast Alabama to the rainier Gulf Coast, temperature and precipitation vary across the state. In this edition of the Alabama Seasonal Climate Snapshot, we explore how summer climate varies across Alabama during June, July, and August.
Statewide Temperature & Precipitation Trends
All-Time Numbers
The summers of 1902 and 2010 were record-setters in Alabama! They share the record for the hottest average summer temperature at 82.2℉. 1902 takes the throne for the hottest average daily maximum temperature at 95.1℉, and 2010 bears the crown of the hottest average minimum temperature at 71.5℉. On the other end of the thermometer, 1967 was a very cool summer in Alabama, with the coolest average summer temperature of 75.9℉. 1967 also holds the record for the coolest average maximum temperature at 86.5℉. 1976 holds the record for the coolest average minimum temperature at 65.2℉.
1902 was not only the hottest summer on record in Alabama, but the driest too, holding the record with just 7.99” of rain for the whole summer. The summer of 1916 was the wettest on record with a whopping 24.57” of rain!
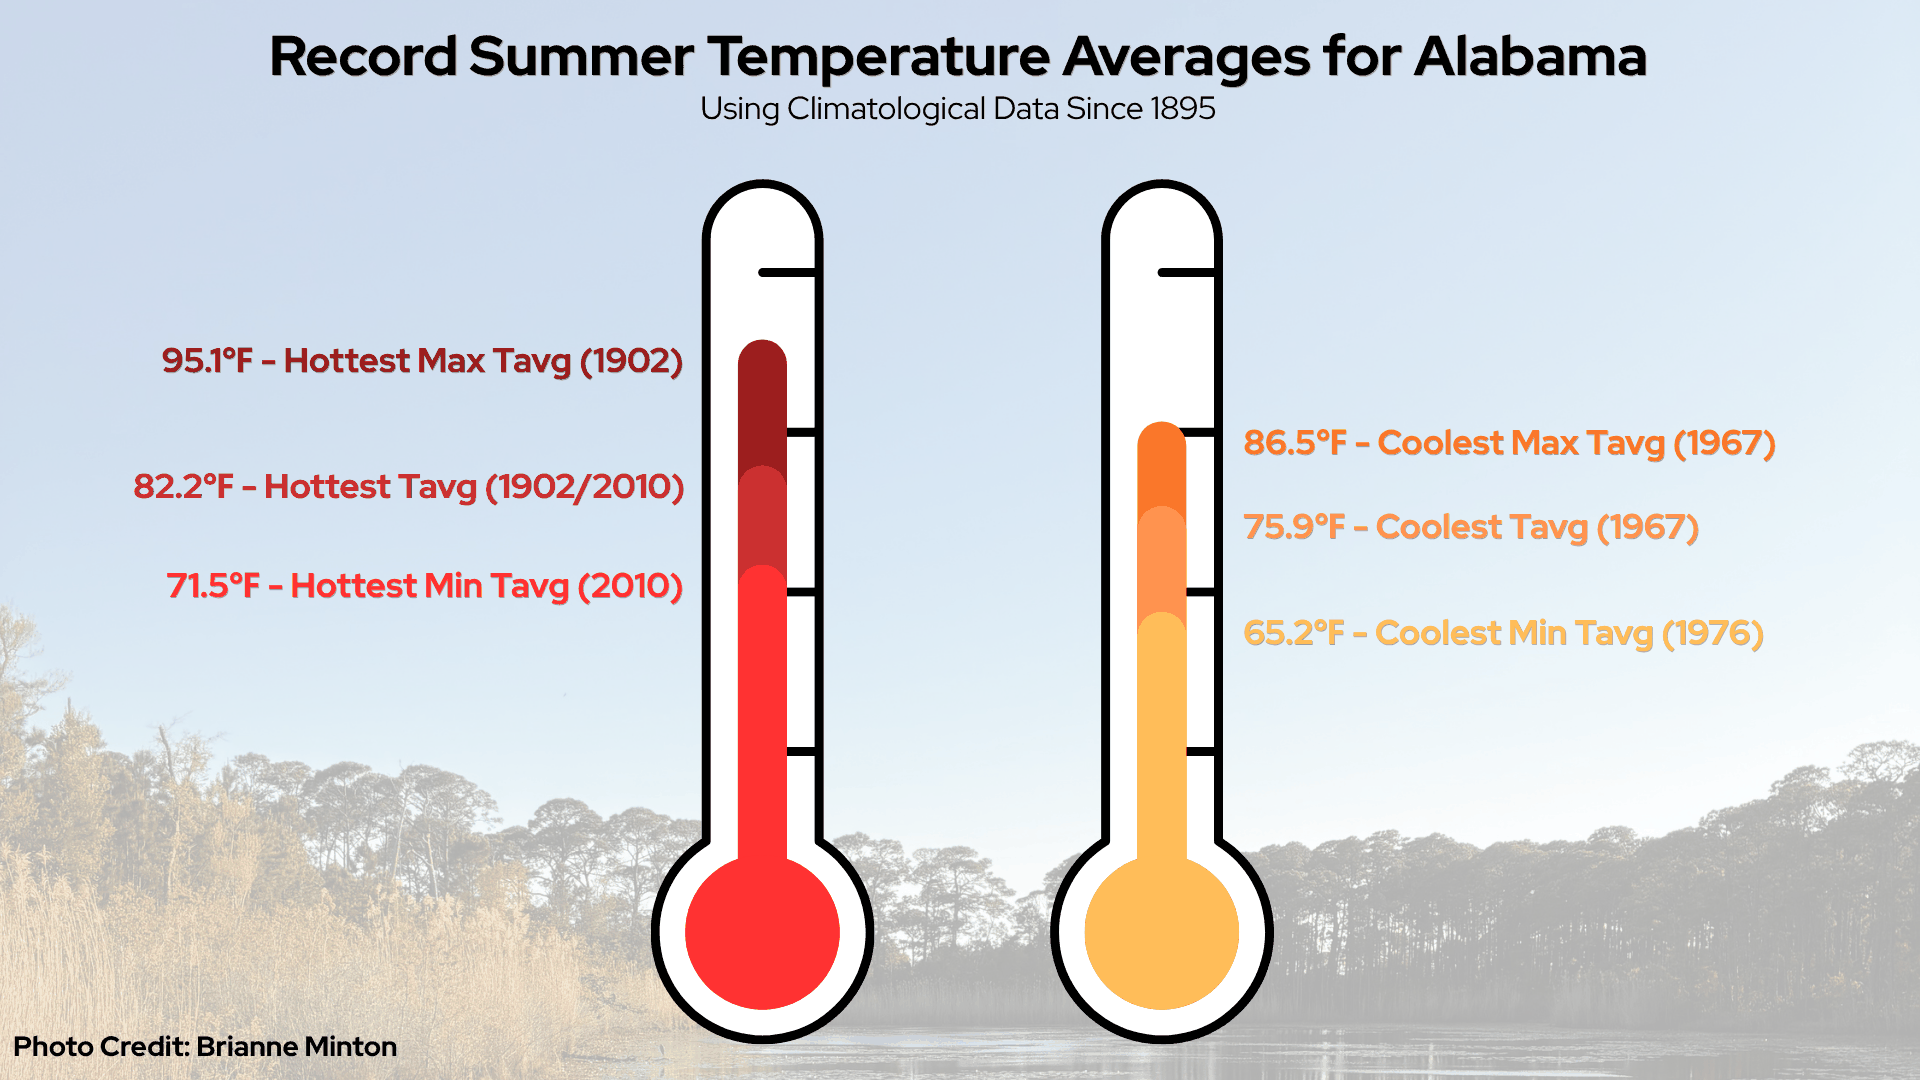
Figure 1. Thermometer visualization of record summer temperatures.
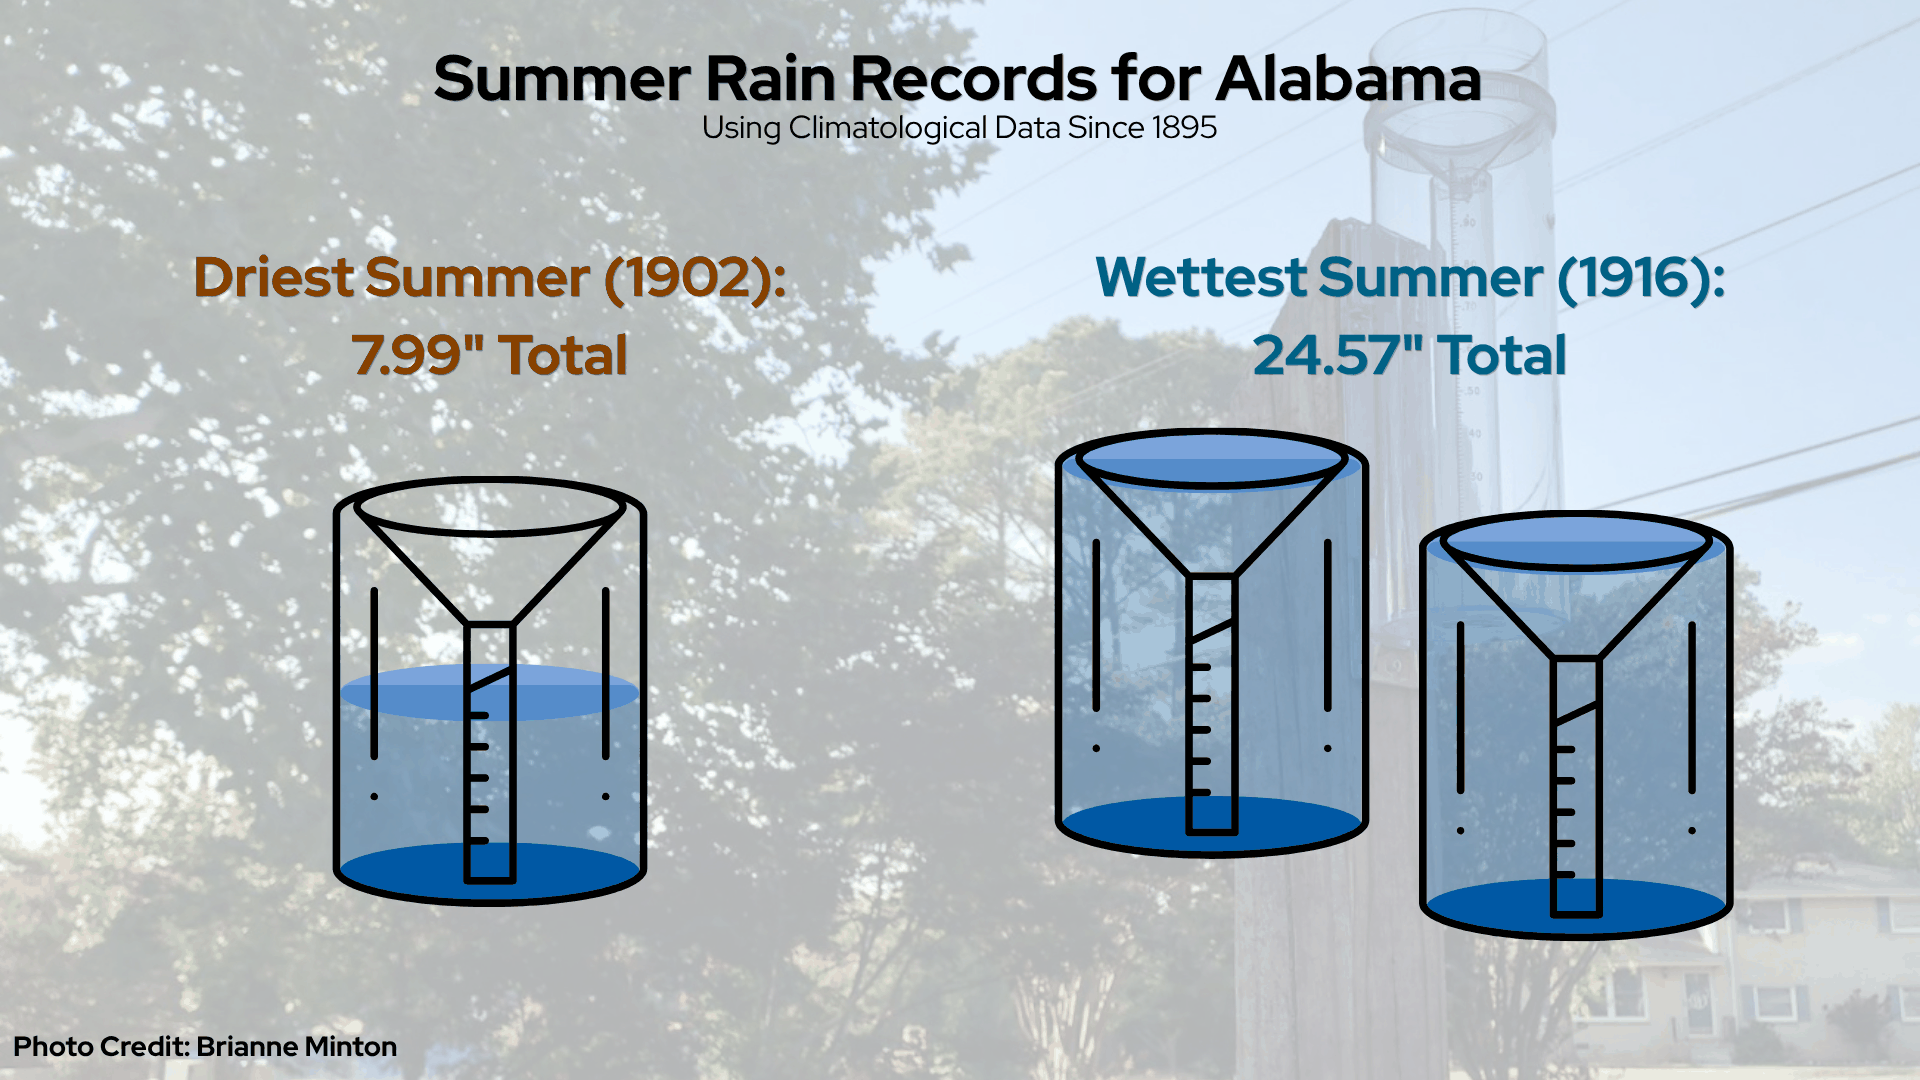
Figure 2. Rain gauge visualization of record summer precipitation.
|
Summer Temperature and Precipitation Records for Alabama | ||
|---|---|---|
| Category | Record | Year |
| Hottest Average Summer Temperature | 82.2℉ | 1902 & 2010 |
| Hottest Average Daily Maximum Temperature | 95.1℉ | 1902 |
| Hottest Average Daily Minimum Temperature | 71.5℉ | 2010 |
| Coolest Average Summer Temperature | 75.9℉ | 1967 |
| Coolest Average Daily Maximum Temperature | 86.5℉ | 1967 |
| Coolest Average Daily Minimum Temperature | 65.2℉ | 1976 |
| Driest Summer | 7.99” total rain | 1902 |
| Wettest Summer | 24.57” total rain | 1916 |
Climatological Period (Using 30-Year Normals from 1991-2020)
Summer Average Temperature (°F)
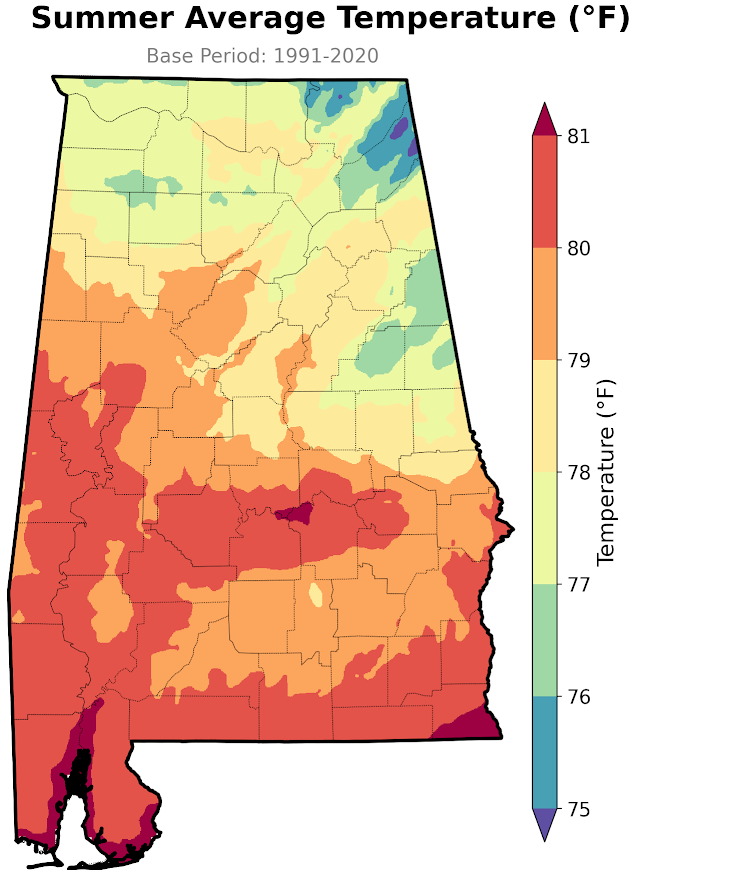
Figure 3. Summer average temperatures across Alabama from 1991 to 2020. Based on NClimGrid dataset.
- Average summer temperatures range from the mid- to upper 70s in northeast Alabama to the low 80s across southern Alabama.
- The coolest summers occur in the higher elevations of DeKalb and Jackson counties.
- The warmest summers are typically found in Mobile, Baldwin, Houston, and Montgomery counties.
Summer Average Low Temperature (°F)
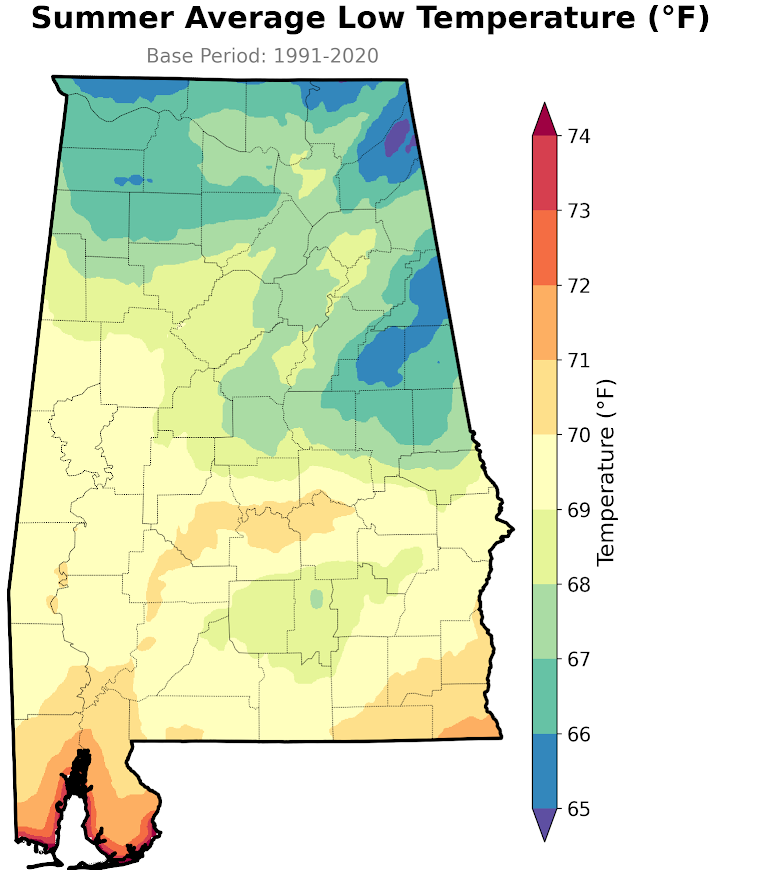
Figure 4. Summer average low temperatures across Alabama from 1991 to 2020. Based on NClimGrid dataset.
- Average summer low temperatures range from the mid-60s in northern Alabama to the mid-70s along the Gulf Coast.
- The coolest overnight temperatures are typically found along the northern border, especially in DeKalb County.
- The warmest overnight temperatures occur in Mobile and Baldwin counties, where average summer lows remain in the 70s.
Summer Average High Temperature (°F)
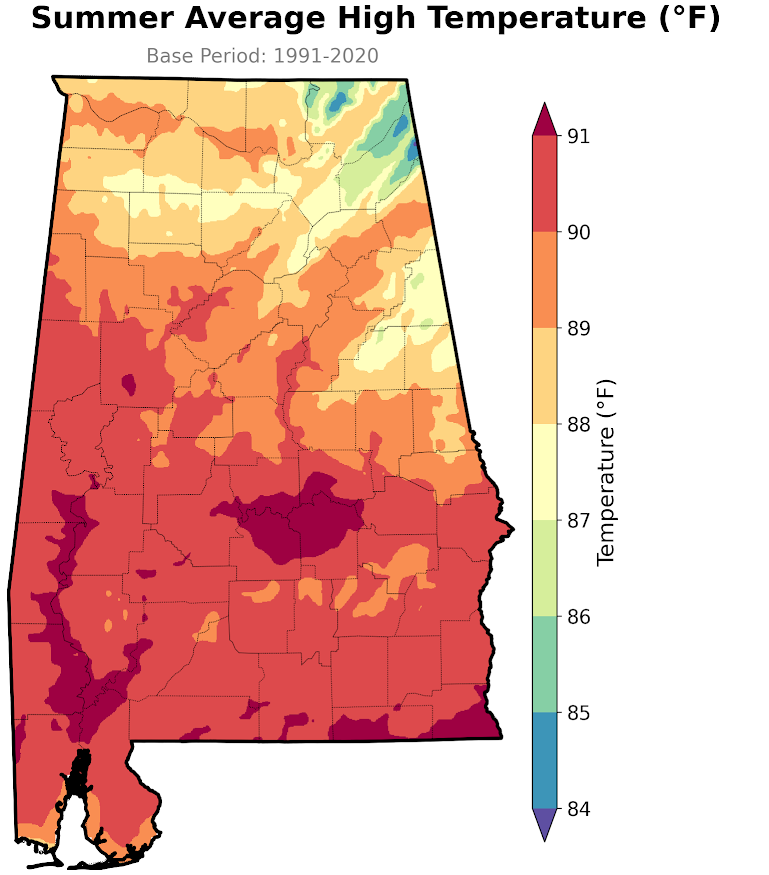
Figure 5. Summer average high temperatures across Alabama from 1991 to 2020. Based on NClimGrid dataset.
- Average summer high temperatures range from the mid-80s in northeast Alabama to the low 90s across parts of central and southern Alabama.
- The coolest daytime highs occur in the higher elevations of northeast Alabama, especially DeKalb County.
- The warmest daytime highs are typically found along the southeastern border, in the non-coastal southwest, and around Montgomery.
- Although the Gulf Coast has some of the warmest average temperatures and overnight lows, it does not experience the hottest daytime highs. The nearby Gulf of Mexico helps moderate temperatures, keeping summer days slightly cooler while also keeping nights warmer than inland areas.
Summer Precipitation Totals (inches)
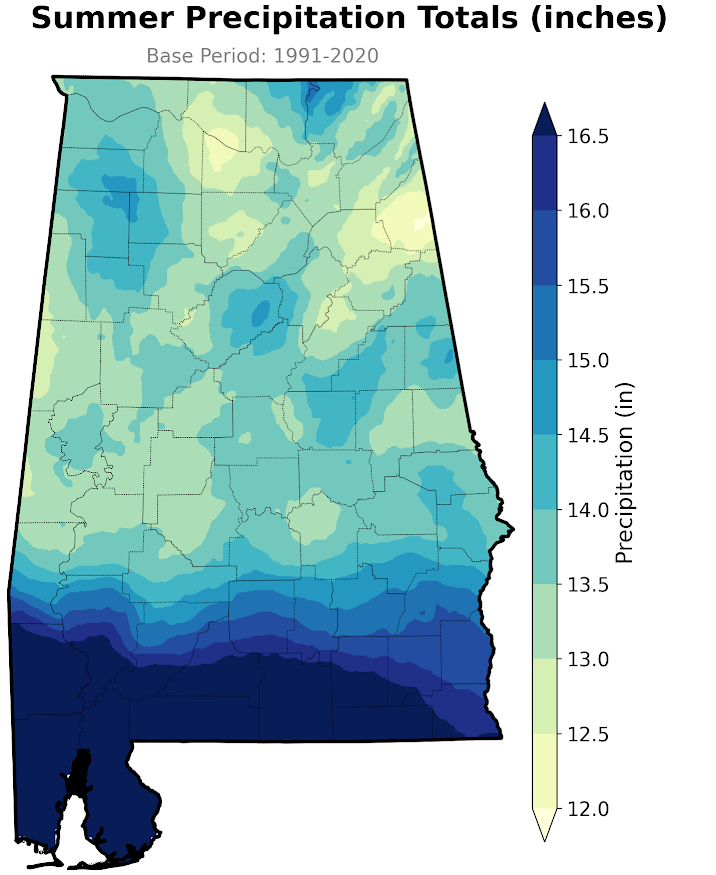
Figure 6. Summer precipitation totals across Alabama from 1991 to 2020. Based on NClimGrid dataset.
- Average summer precipitation ranges from less than 12 inches in parts of north Alabama to more than 16.5 inches along the Gulf Coast.
- The driest areas are generally found across north-central and northeastern Alabama.
- The wettest conditions occur along Alabama's southern border, especially in Mobile and Baldwin counties.
- Rainfall increases noticeably from north to south as moisture from the Gulf of Mexico fuels frequent summertime thunderstorms.
- Tropical systems can also contribute to the higher seasonal rainfall totals along the coast.
Seasonal Topic: Wet Bulb Globe Temperature
Everyone knows Alabama summers are hot, but did you know there are more ways to measure heat than just air temperature? While the temperature on a thermometer tells us how hot the air is, it doesn't tell the whole story. Humidity, sunshine, and wind all influence how our bodies experience heat outdoors. That's where Wet Bulb Globe Temperature (WBGT) comes in. By combining these environmental factors, WBGT provides a more complete picture of heat stress and is widely used to help protect outdoor workers, athletes, military personnel, and anyone spending extended time outside. We use WBGT risk levels, defined in the table below, to visually categorize the heat intensity at all measured WBGT indices. If you're interested in learning more about WBGT and how it is being used to improve heat safety and messaging, be sure to also check out our NWS Huntsville Heat Study blog.
To better understand how WBGT varies across Alabama, we analyzed June, July, and August conditions from 2001 to 2023 using NASA's NLDAS-3 beta forcing data. The graphs below highlight average summertime WBGT values across Huntsville, Birmingham, Montgomery, and Mobile cities. To view more WBGT data, visit our data repository. If you have any questions about summer trends, please direct them to aosc@uah.edu!
|
Korey Stringer Institute Region 3 WBGT Risk Levels | |
|---|---|
| Heat Category | WBGT Index |
| No Flag | < 82.2℉ |
| Low (Green Flag) | 82.2℉ - 87.0℉ |
| Moderate (Yellow Flag) | 87.1℉ - 90.0℉ |
| High (Red Flag) | 90.1℉ - 92.0℉ |
| Extreme (Black Flag) | < 92.1℉ |
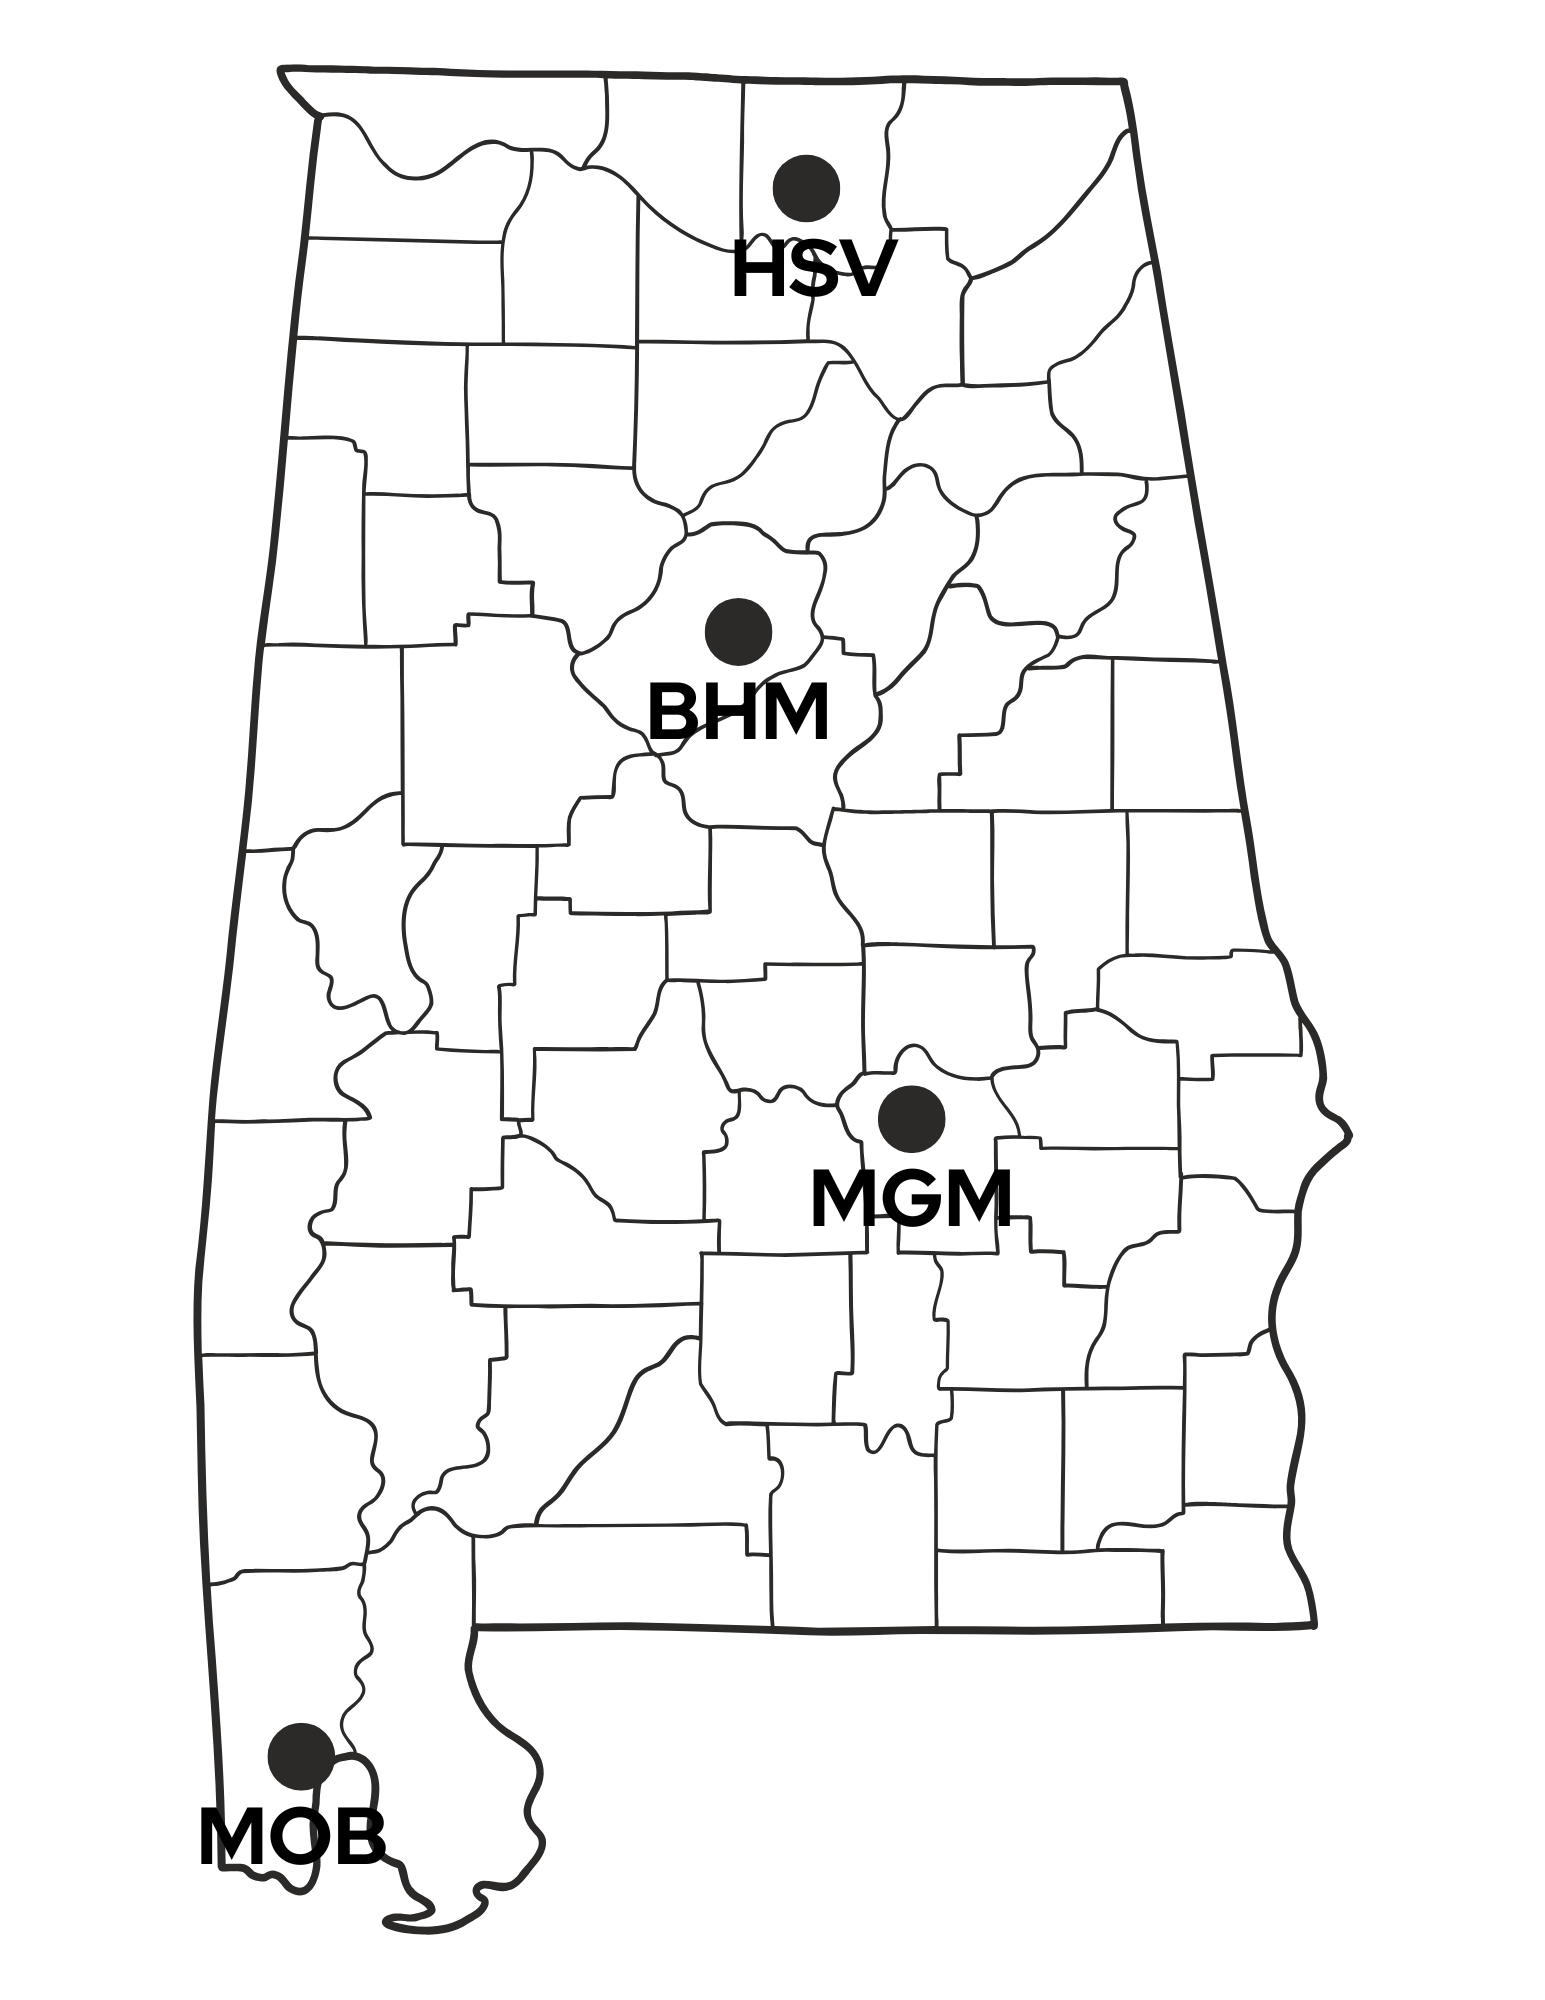
Figure 7. Map of all locations mentioned in this article.
Statewide Trends
- All locations tend to stay below or within moderate risk all day throughout summer.
- In June, no location exceeded low-risk WBGT at any time.
- In July, all locations experienced moderate risk WBGT during the daytime.
- In August, Mobile, Montgomery, and Birmingham experienced moderate risk during the daytime, while Huntsville maintained low risk all day.
- All locations have records of experiencing extreme risk WBGTs.
- The highest daily WBGT occurred at 13:00 (1:00pm) throughout summer at all locations.
- Generally, there is no risk between 21:00 and 05:00 (9:00pm and 5:00am).
- Extreme risk WBGTs only occurred between 10:00 and 16:00 (10:00am and 4:00pm).
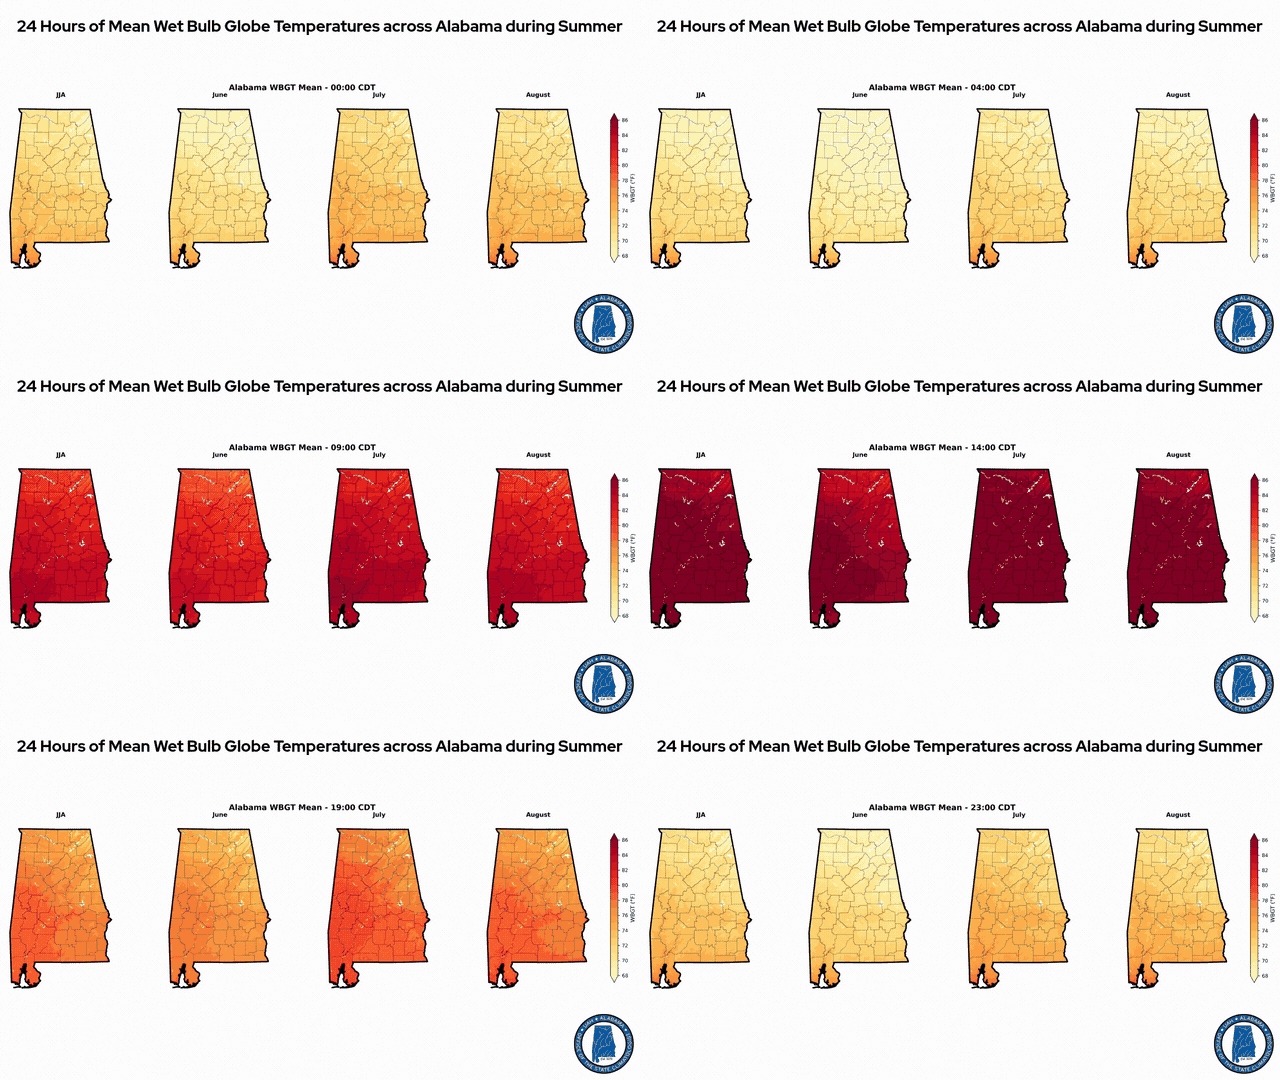
Figure 8. 24-hour loop of statewide mean WBGT per hour in climatological summer, June, July, and August.
Regional Trends
For our regional WBGT trends, we represent the data with ridgeline plots. These may look a bit confusing at first, so here are some tips on how to interpret the data.
- The vertical axis is time in hours, covering a 24-hour day.
- The horizontal axis is the WBGT index, spanning from low to extreme conditions.
- There is a bell curve showing the distribution of WBGT for each hour on the graph. The highest point in the middle of the bell curve is the most frequently recorded WBGT index for that hour. On the left and right ends of the curve are the lowest and highest WBGTs recorded for that hour.
- The white dashed line in the middle of each bell curve is the mean WBGT for that hour.
Take, for example, the WBGT bell curve in Huntsville for JJA (June, July, August) at 12:00. The lowest WBGT recorded was around 72°F and in the no-risk zone. The highest WBGT recorded was around 95°F and in the extreme risk zone. The mean WBGT is about 85°F and in the low-risk zone.
Huntsville (HSV) WBGT
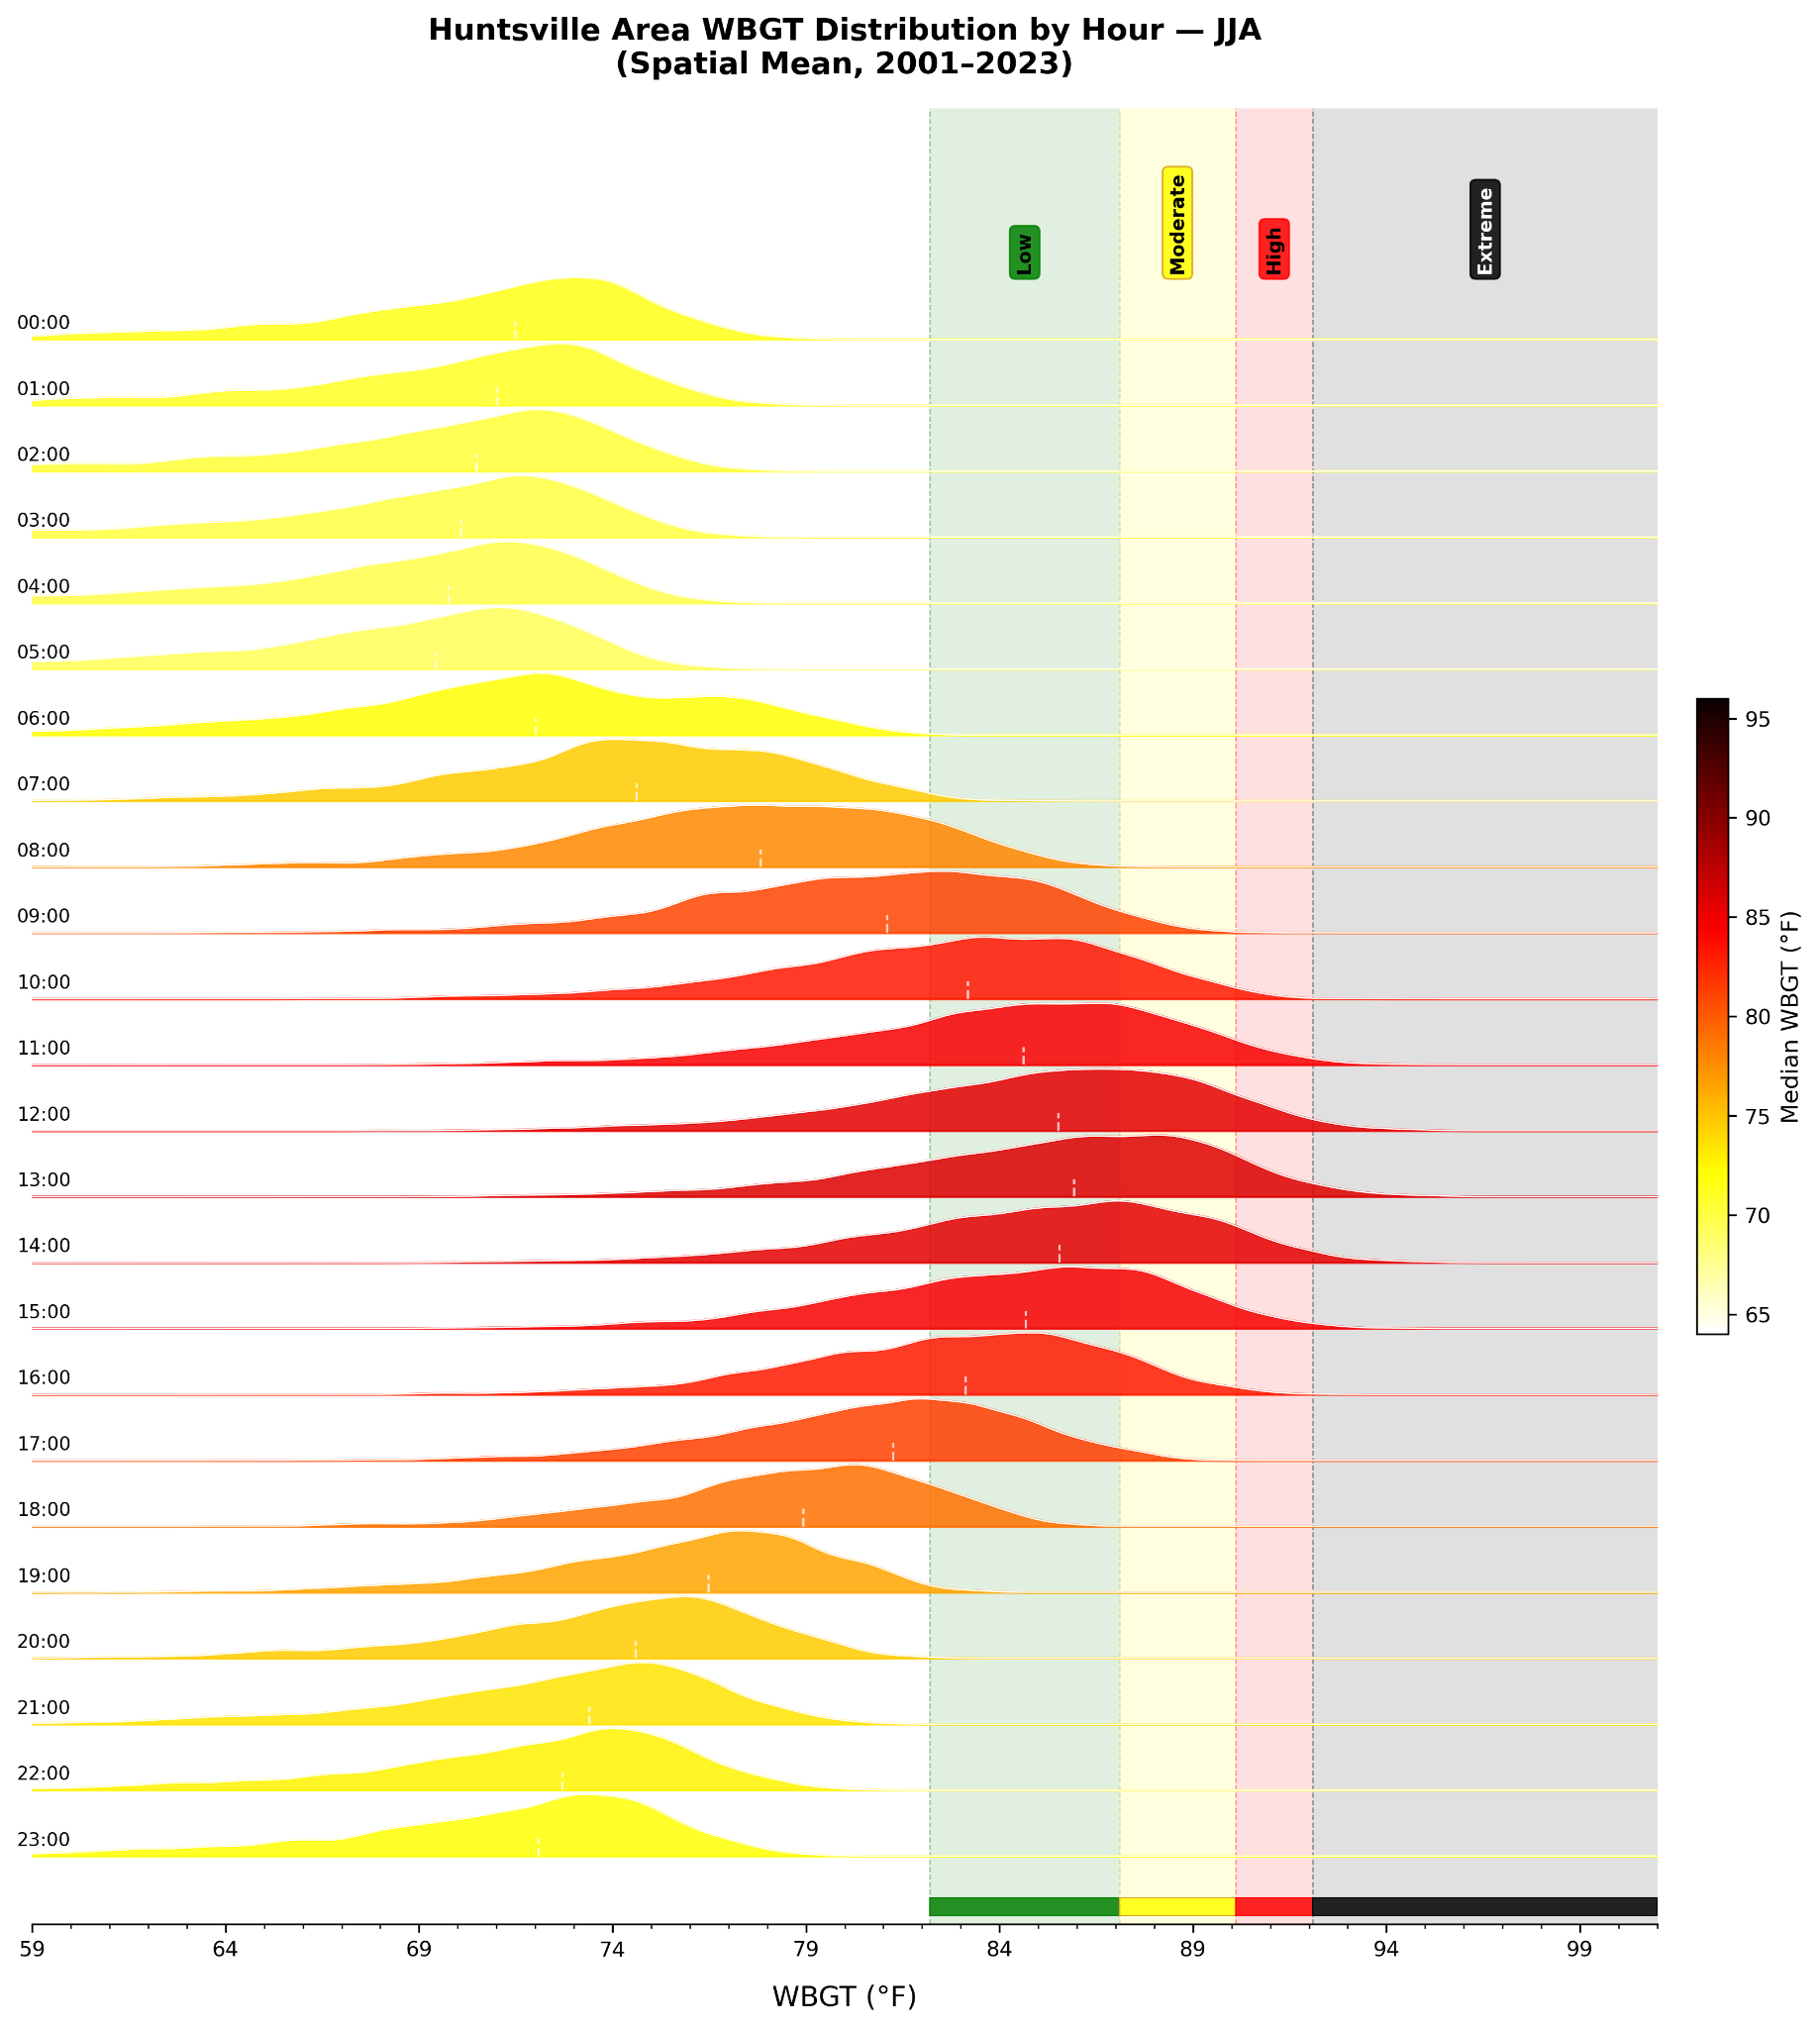
Figure 9. Huntsville area WBGT distribution by hour (JJA, spatial mean, 2001–2023).
- At the earliest, low risk WBGT is reached at 6:00am, though usually it is reached between 9:00am and 11:00am.
- WBGTs continue to rise until they peak at 1:00pm, after which they begin to fall.
- In very extreme cases, WBGT can rise high enough to achieve and stay in extreme risk from 11:00am to 4:00pm.
- At the latest, risk completely diminishes after 8:00pm, although this usually happens after 3:00pm to 5:00pm.
- WBGT in Huntsville on average only ventures into moderate risk in July but usually stays within low risk throughout the rest of the summer.
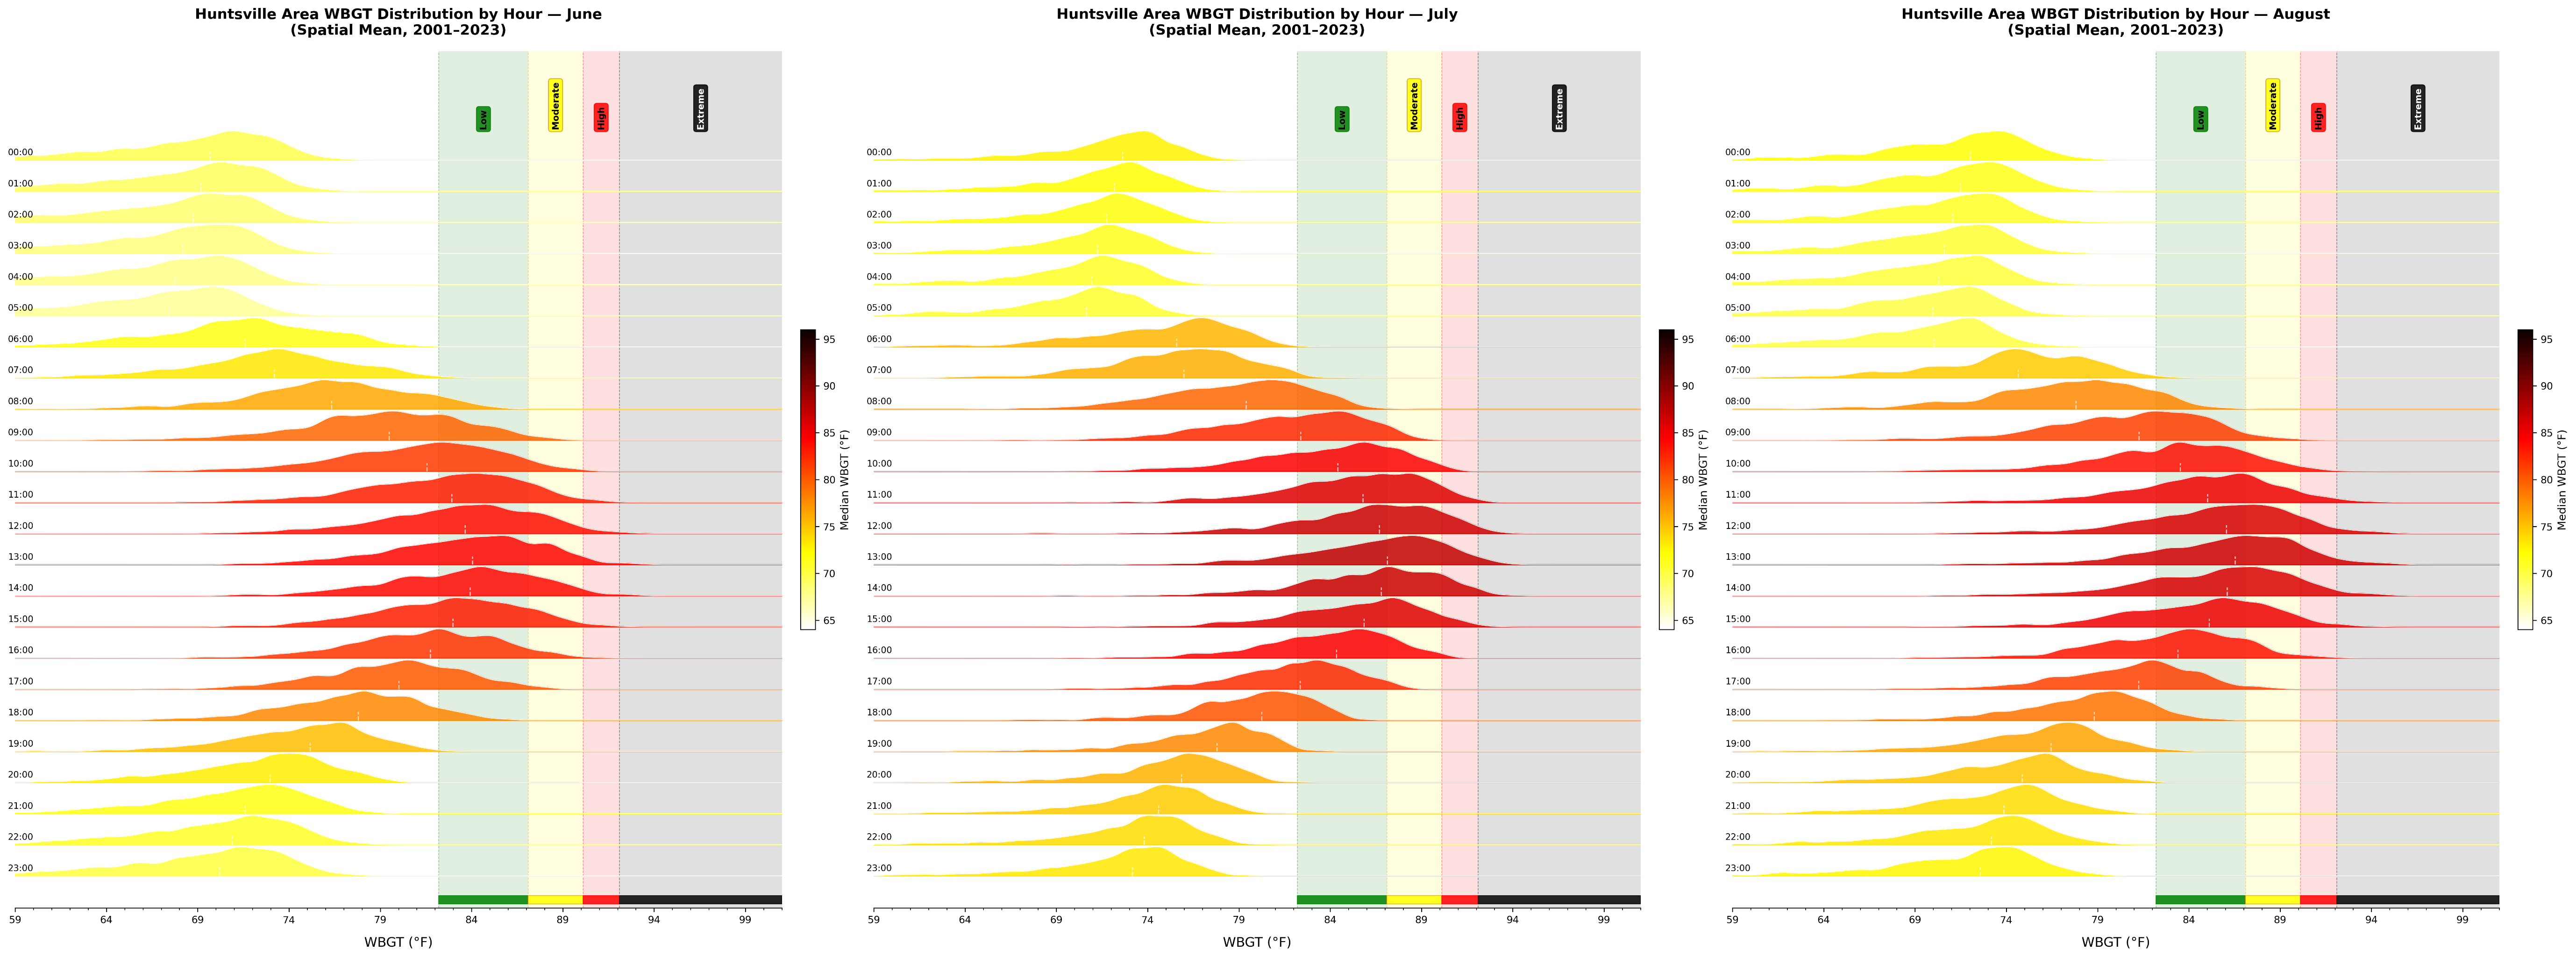
Figure 10. Huntsville area WBGT distribution by hour — June, July, and August.
Birmingham (BHM) WBGT
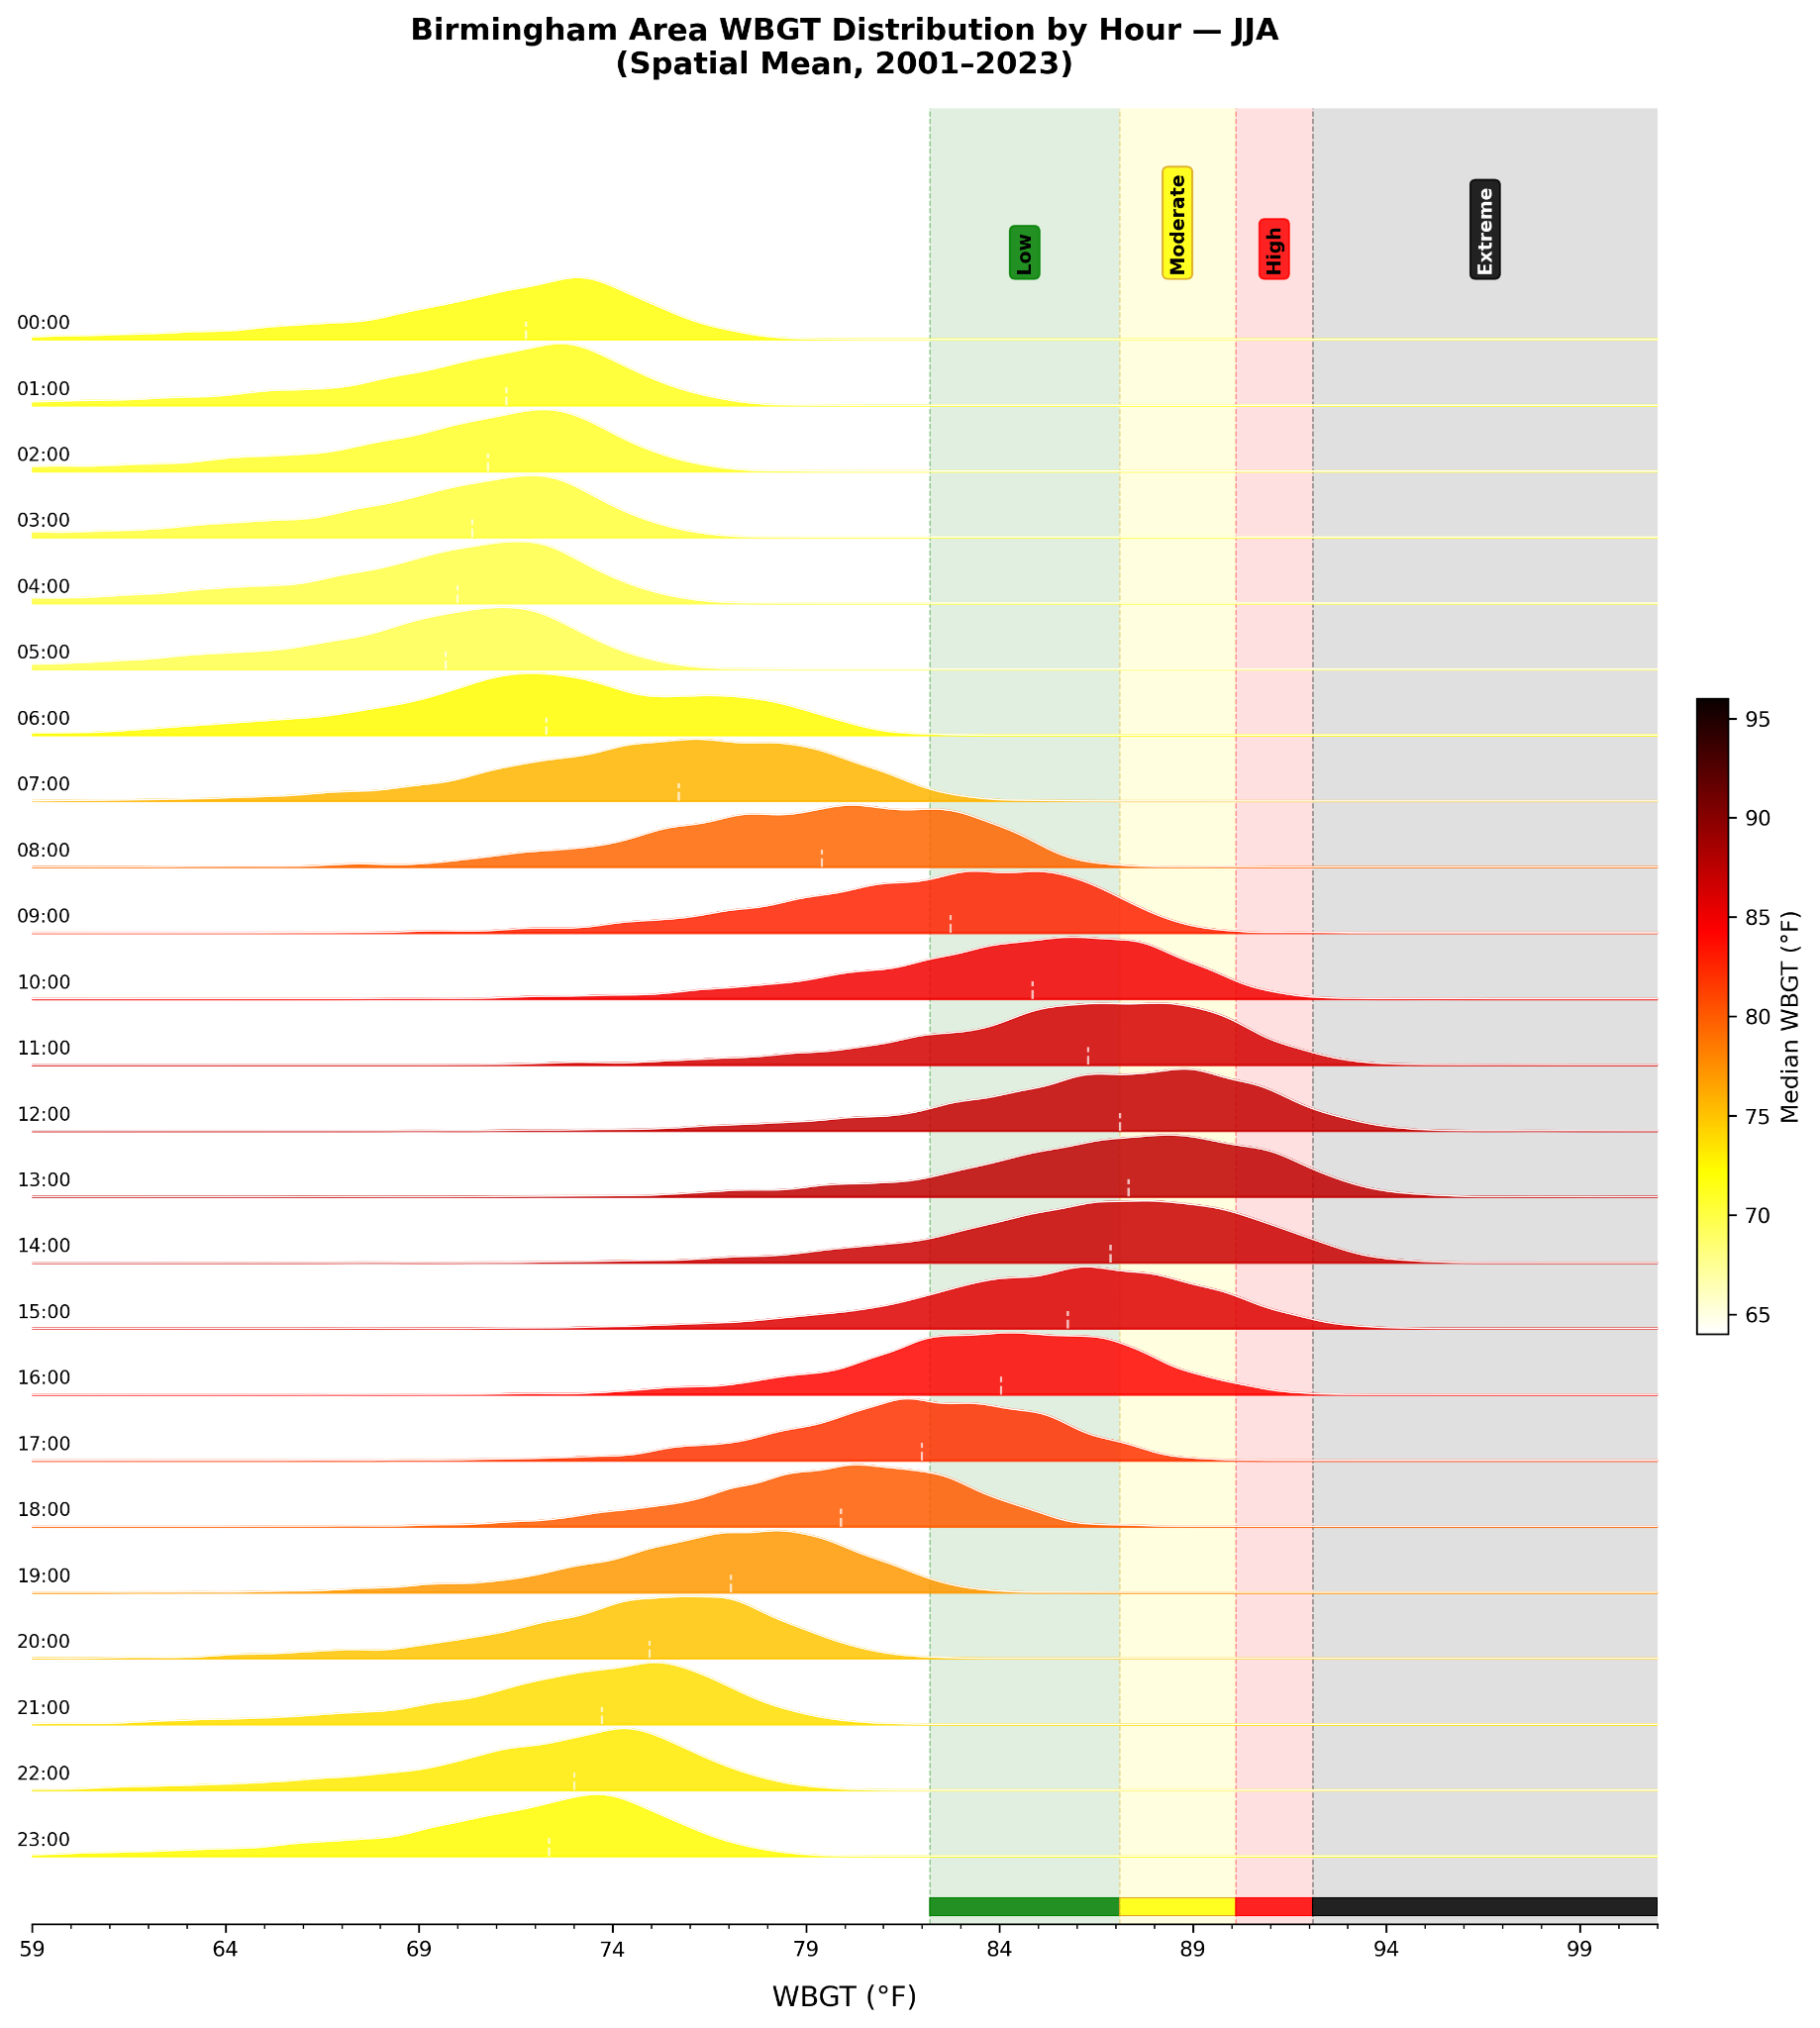
Figure 11. Birmingham area WBGT distribution by hour (JJA, spatial mean, 2001–2023).
- At the earliest, low risk WBGT is reached at 6:00am, though usually it is reached between 9:00am and 10:00am.
- WBGTs continue to rise until they peak at 1:00pm, after which they begin to fall.
- In very extreme cases, WBGT can rise high enough to achieve and stay in extreme risk from 10:00am to 4:00pm.
- At the latest, risk completely diminishes after 8:00pm, although this usually happens after 4:00pm to 5:00pm.
- WBGT in Birmingham on average stays in low risk throughout June but reaches moderate risk in July and August.
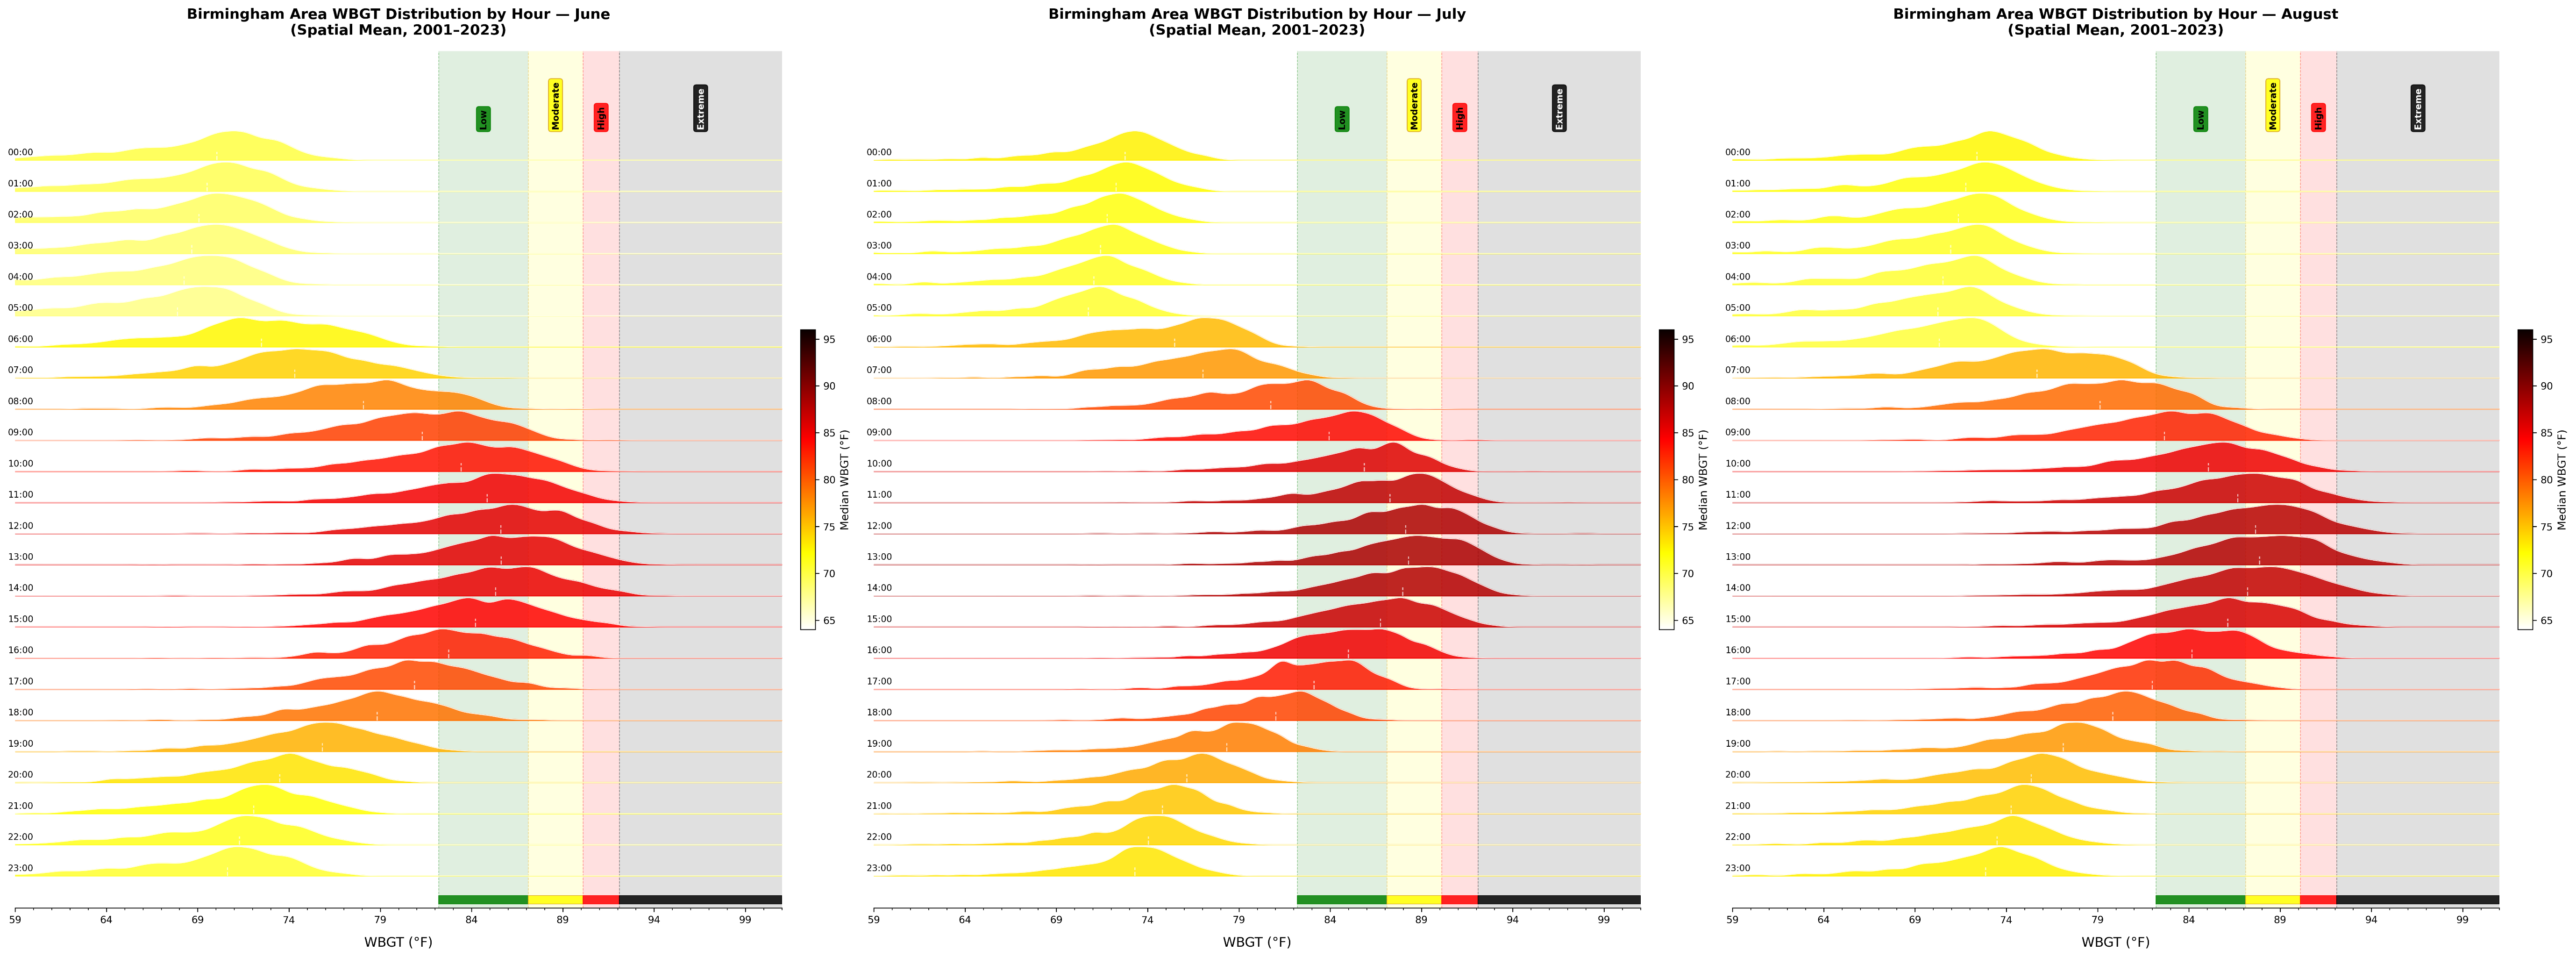
Figure 12. Birmingham area WBGT distribution by hour — June, July, and August.
Montgomery (MGM) WBGT
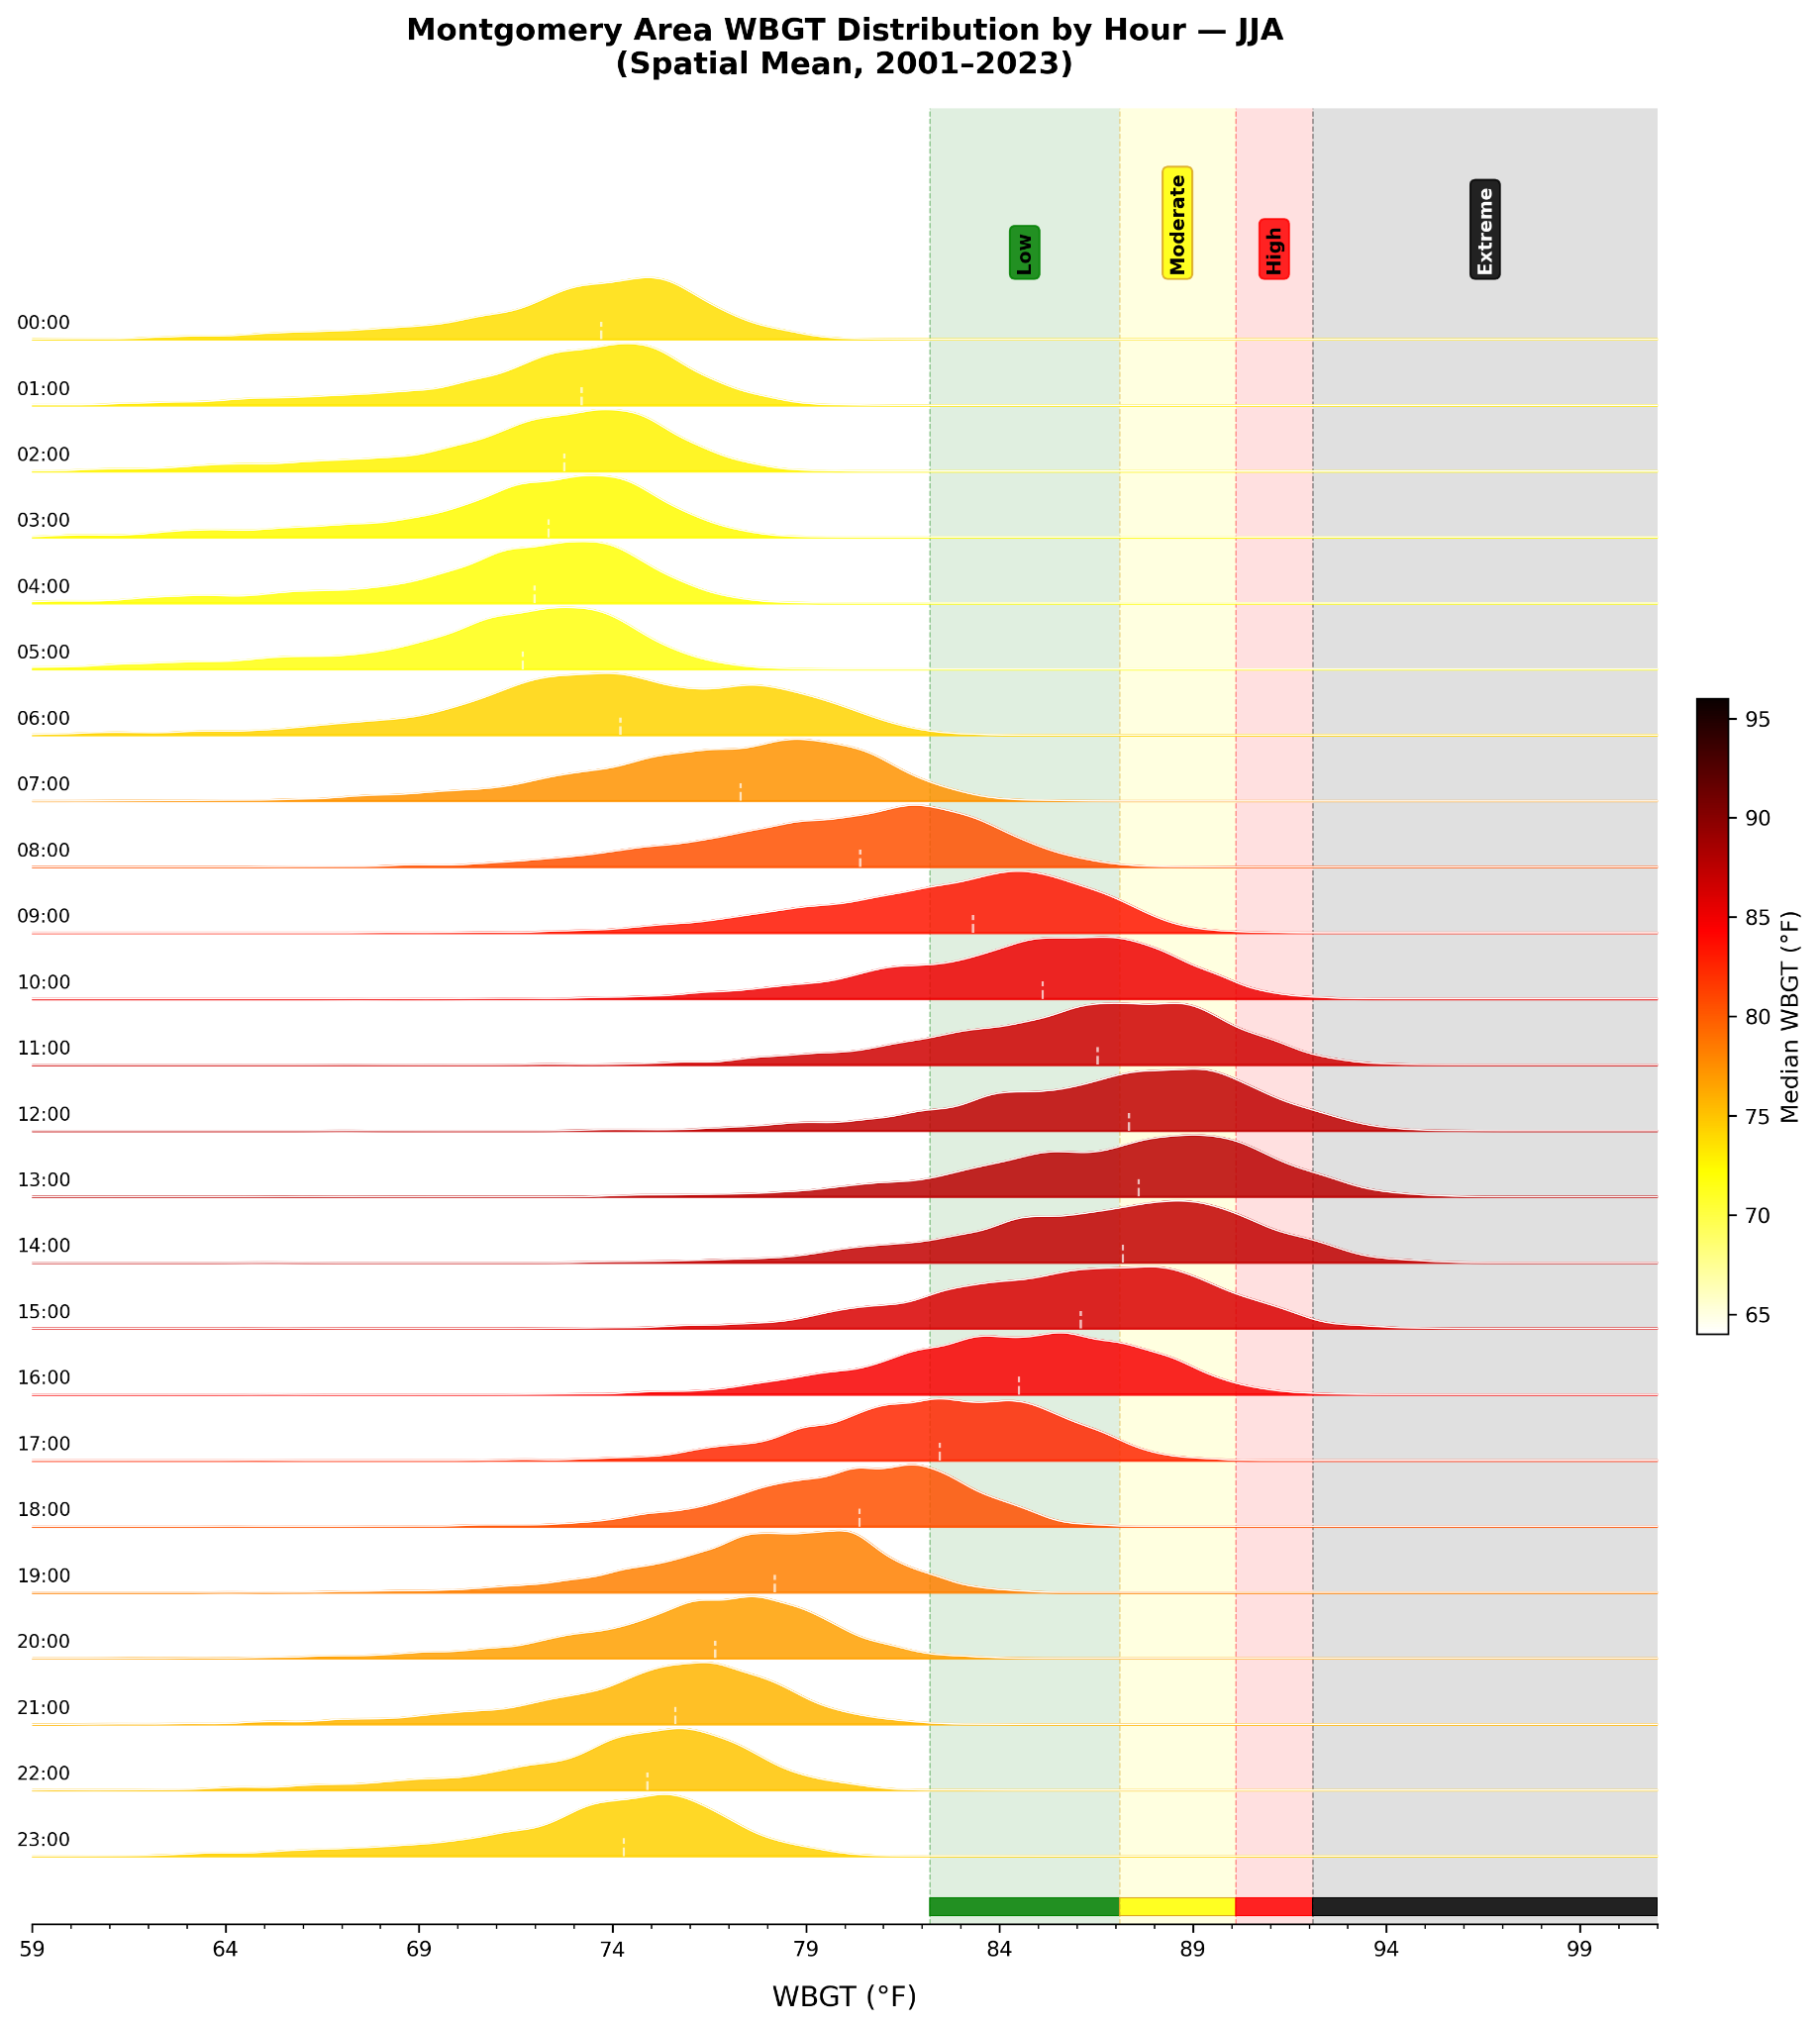
Figure 13. Montgomery area WBGT distribution by hour (JJA, spatial mean, 2001–2023).
- At the earliest, low risk WBGT is reached at 6:00am, though usually it is reached between 9:00am and 10:00am.
- WBGTs continue to rise until they peak at 1:00pm, after which they begin to fall.
- In very extreme cases, WBGT can rise high enough to achieve and stay in extreme risk from 10:00am to 4:00pm.
- At the latest, risk completely diminishes after 9:00pm, although this usually happens after 4:00pm to 5:00pm.
- WBGT in Montgomery on average reaches moderate risk in both July and August but usually stays within low risk throughout June.
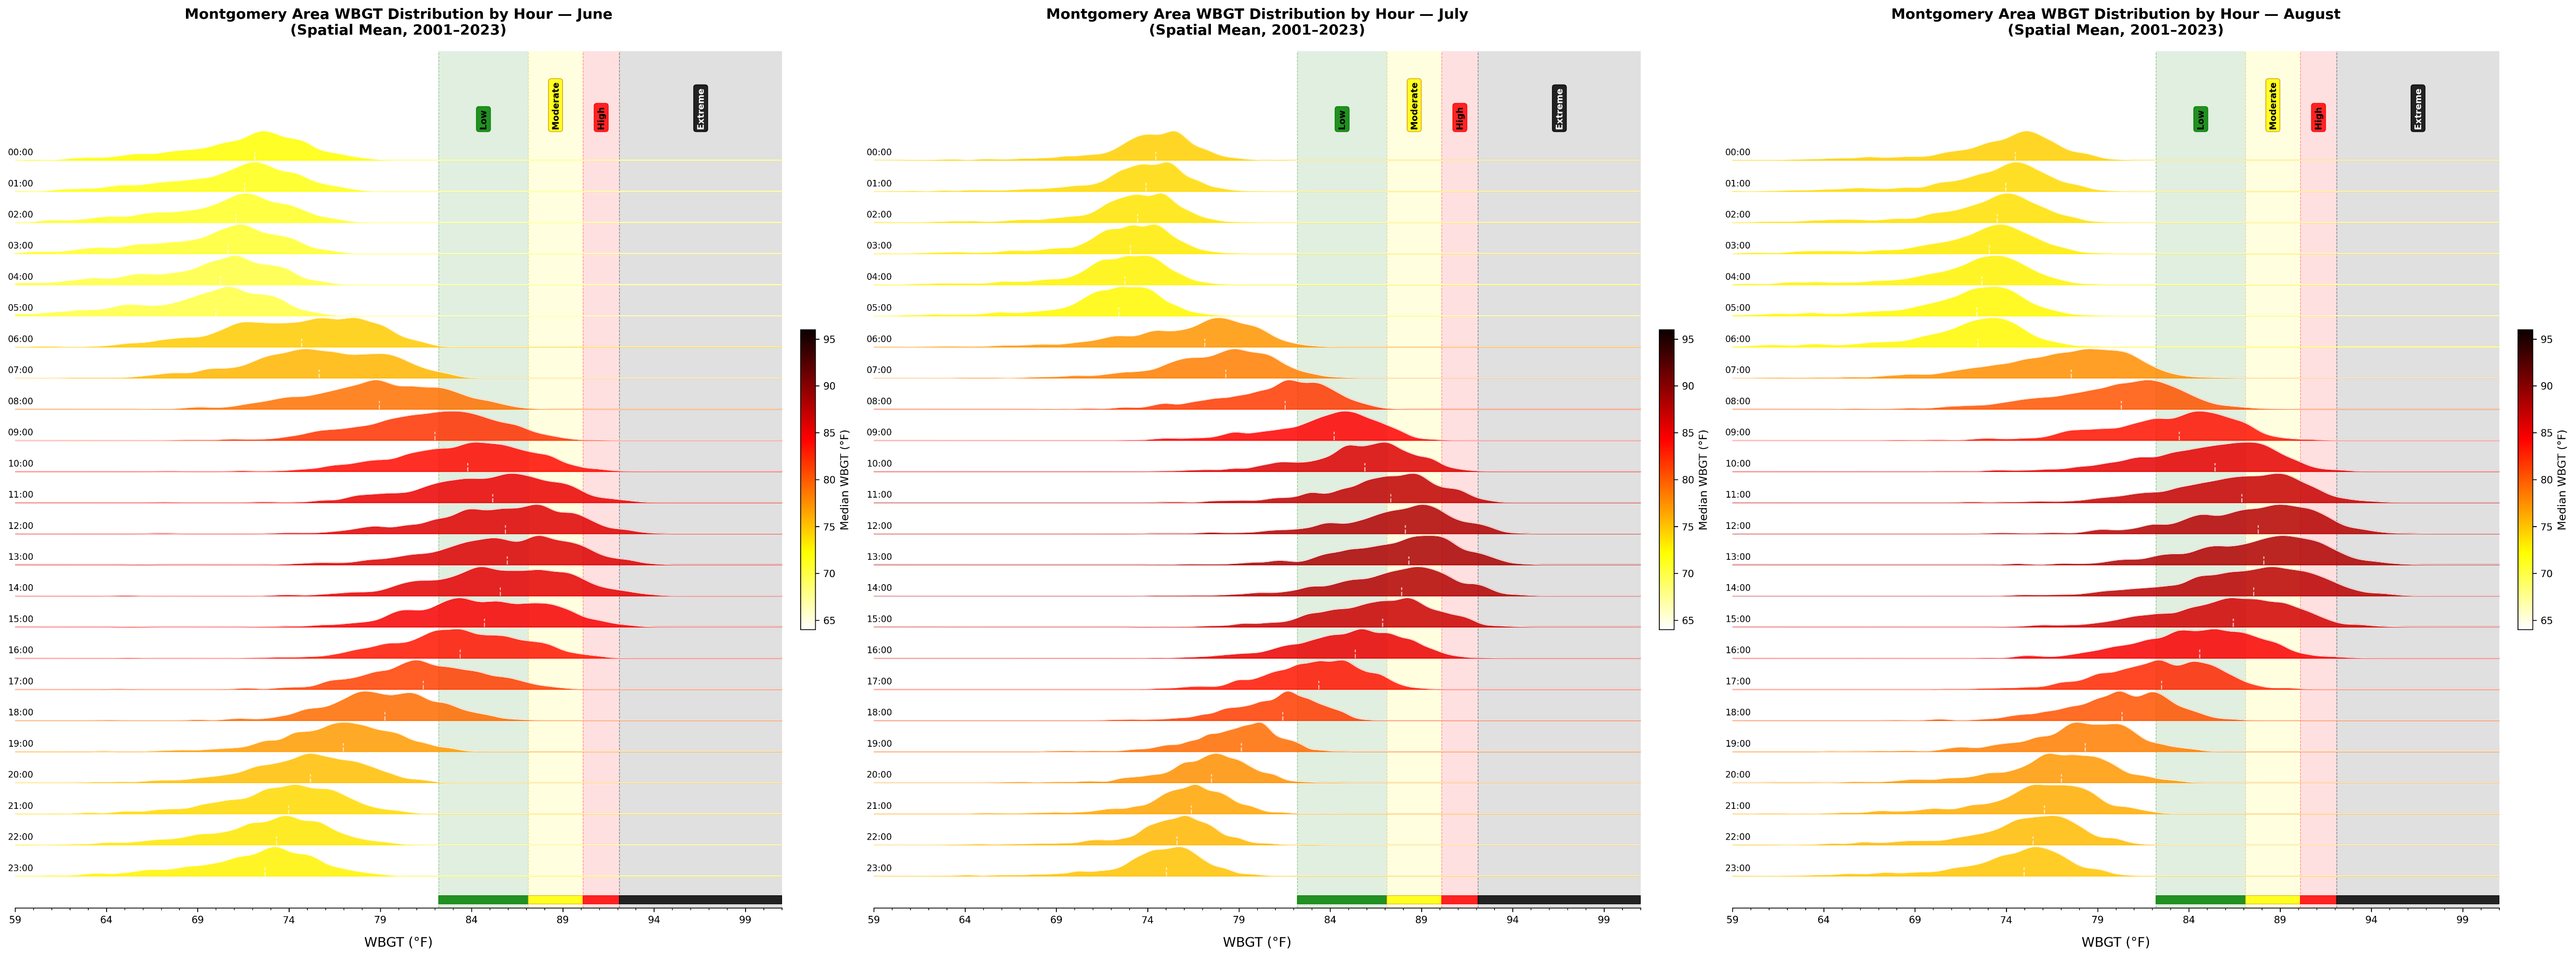
Figure 14. Montgomery area WBGT distribution by hour — June, July, and August.
Mobile (MOB) WBGT
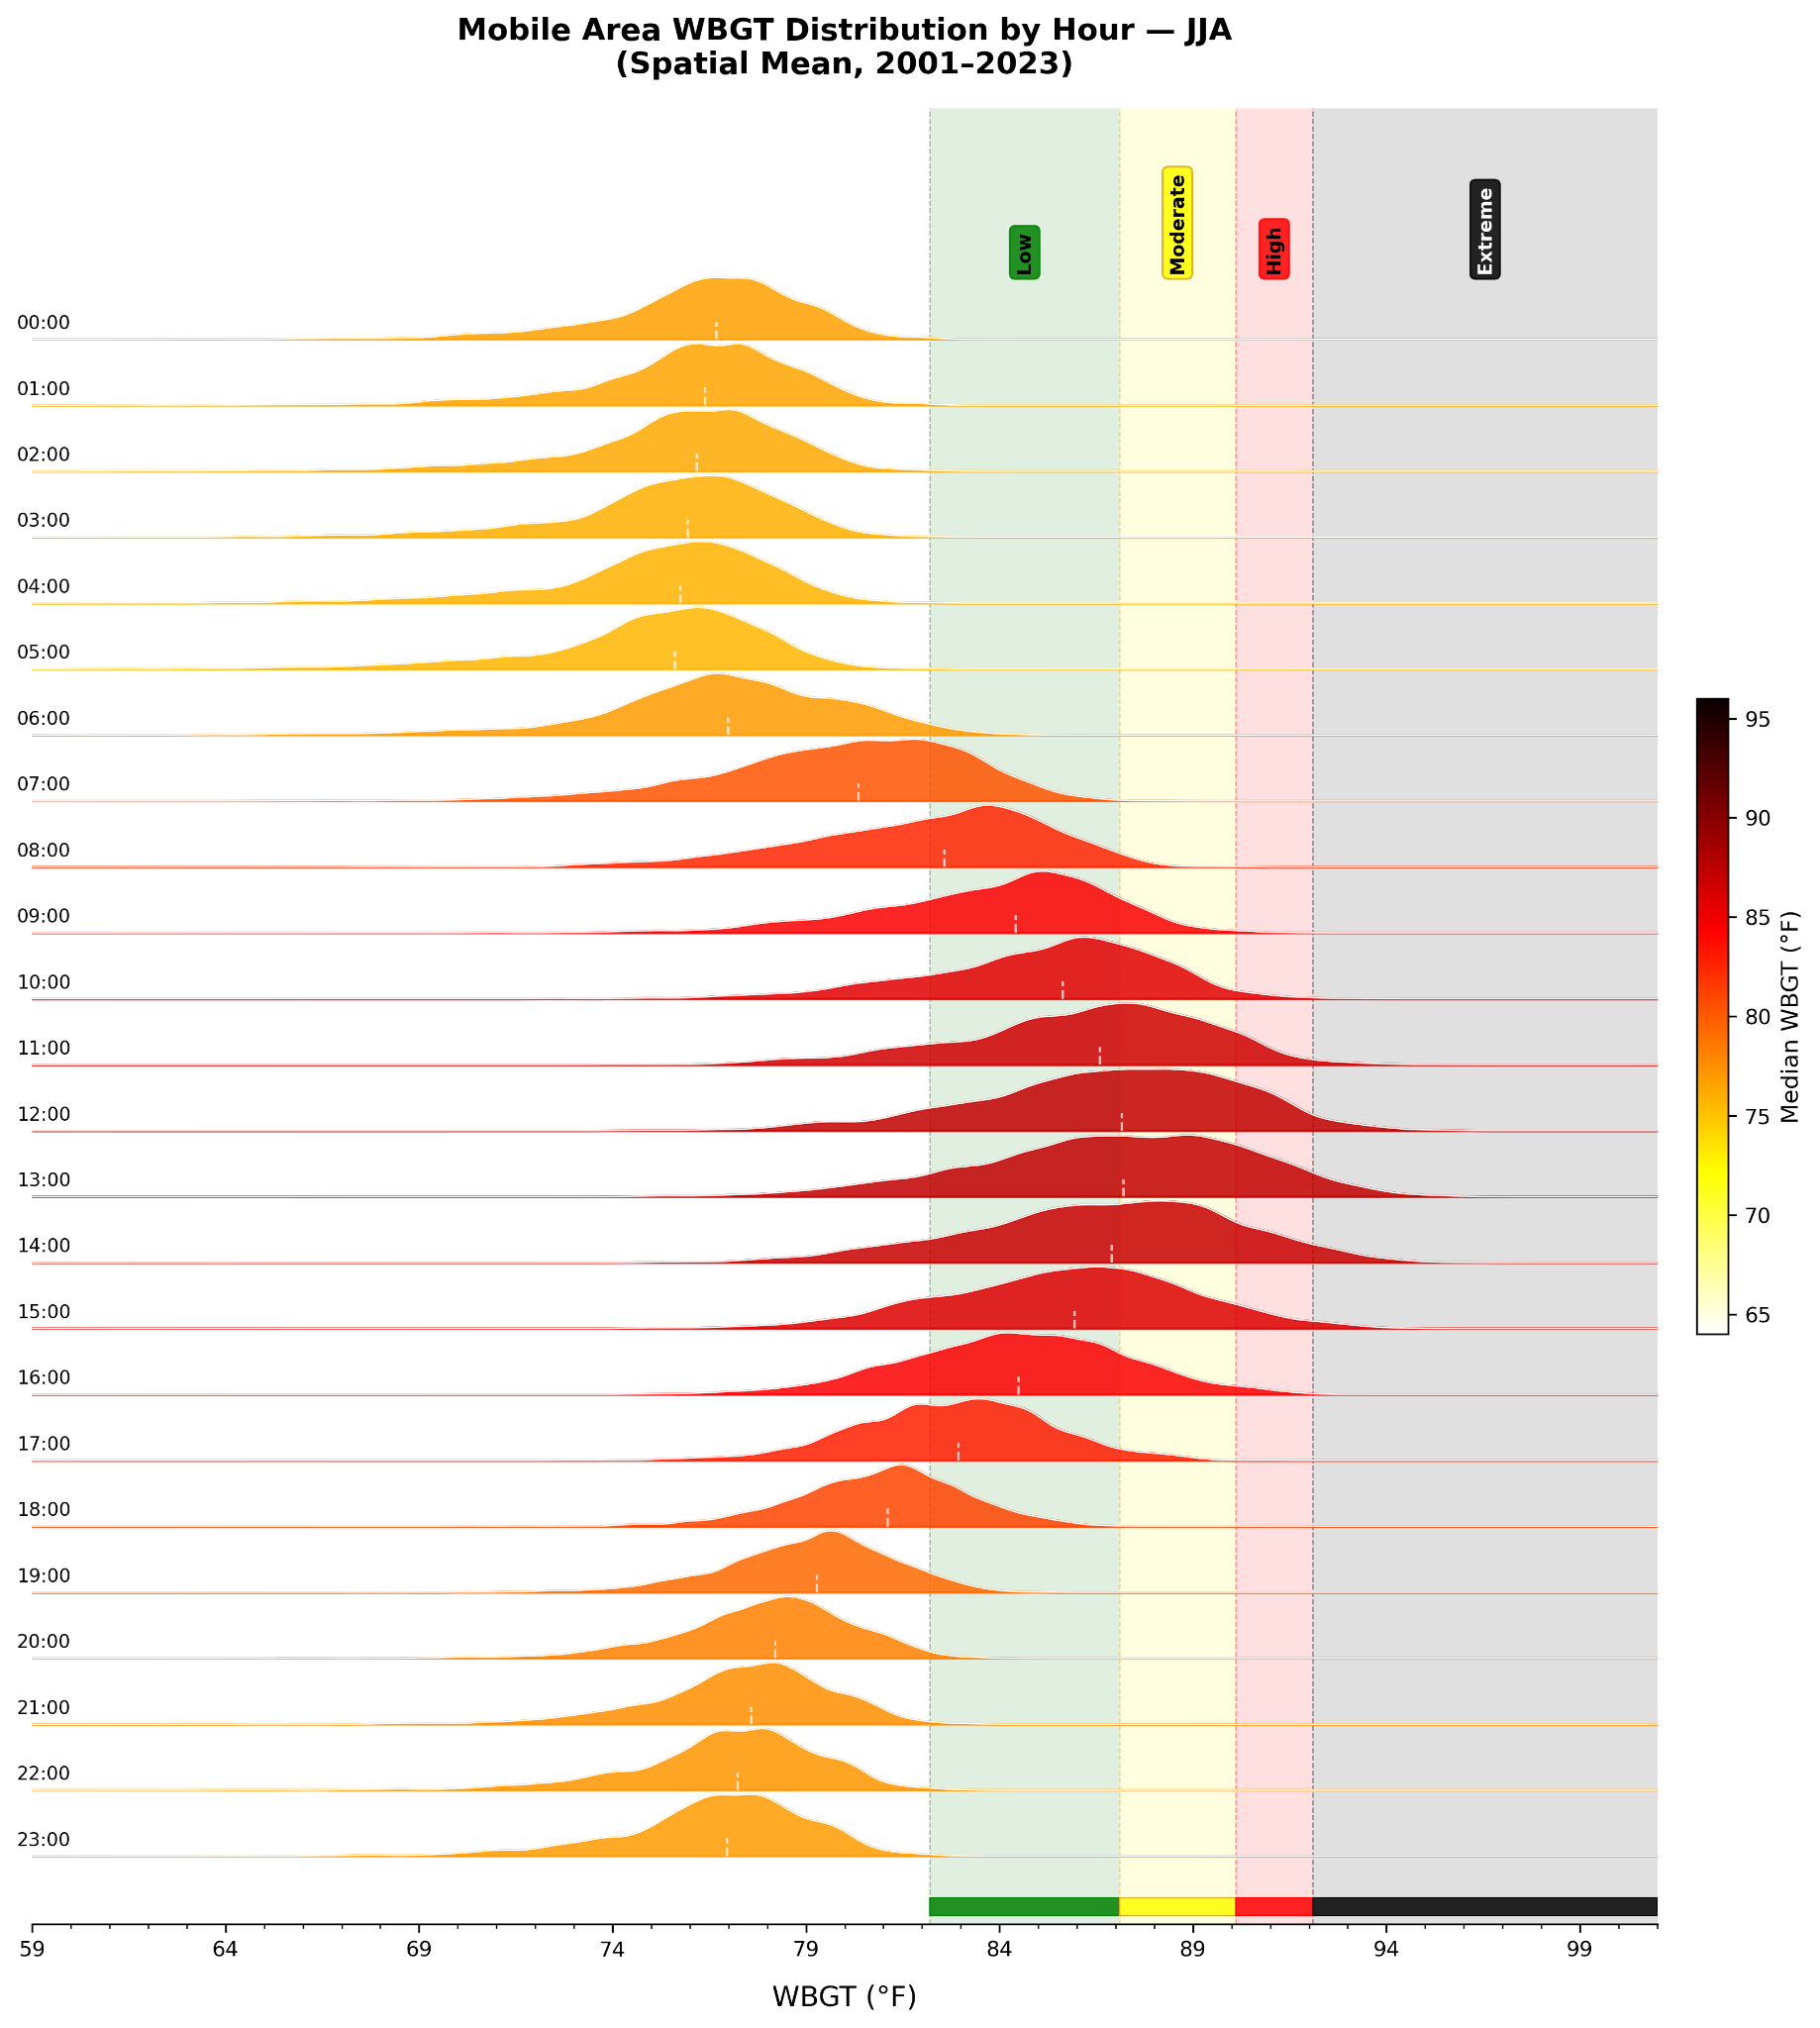
Figure 15. Mobile area WBGT distribution by hour (JJA, spatial mean, 2001–2023).
- During August in extreme cases, Mobile can be at a constant low risk, though usually they get some reprieve overnight and it is reached between 8:00am and 9:00am.
- WBGTs continue to rise until they peak at 1:00pm, after which they begin to fall.
- In very extreme cases, WBGT can rise high enough to achieve and stay in extreme risk from 10:00am to 4:00pm.
- While risk never diminishes in extreme cases, this usually happens after 4:00pm to 5:00pm.
- WBGT in Mobile on average stays in low-risk in June but steps into moderate risk throughout the rest of the summer.
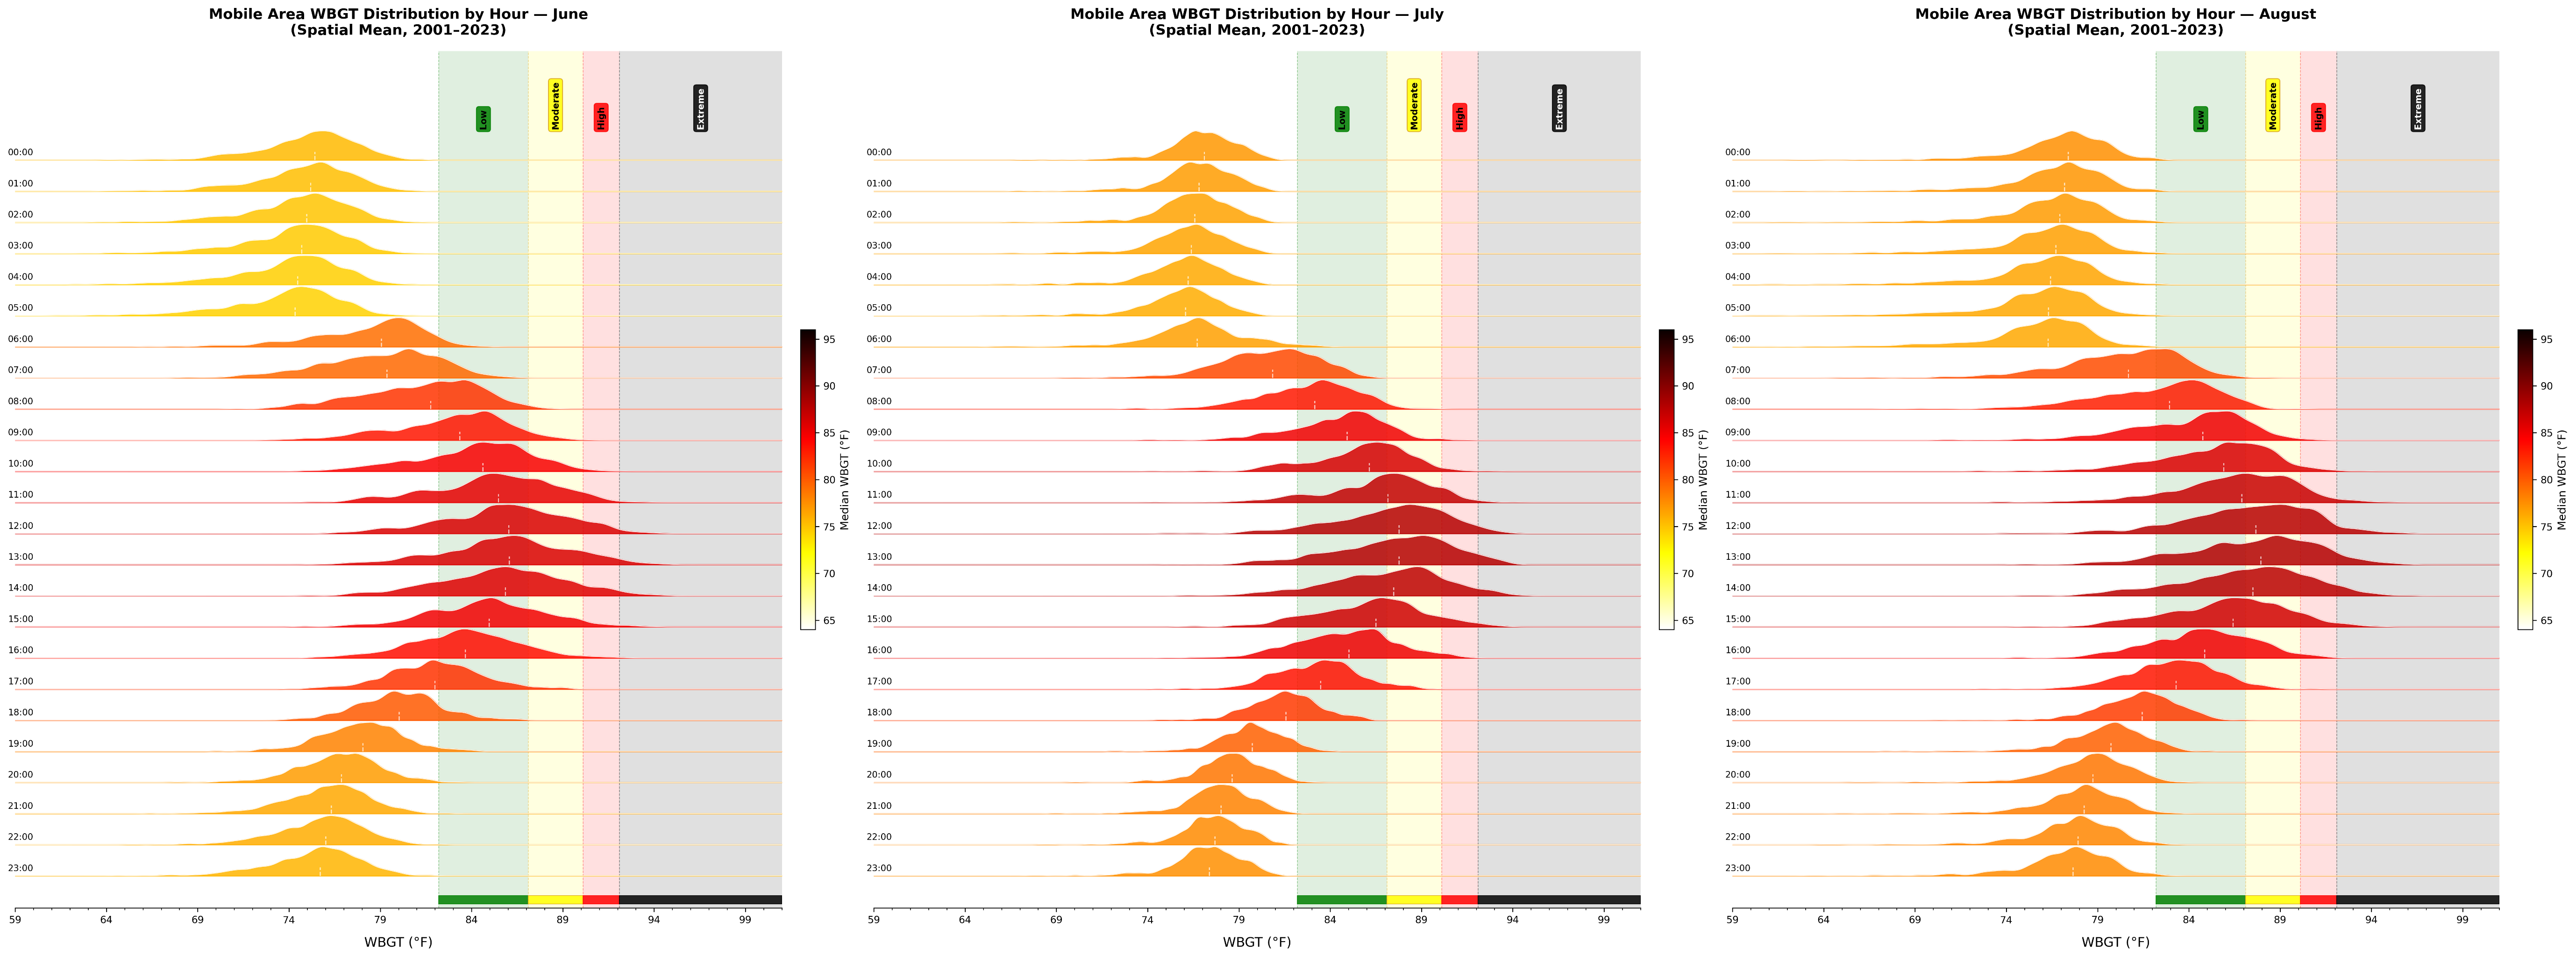
Figure 16. Mobile area WBGT distribution by hour — June, July, and August.