Written by: Katherine Nemec
With Technical Expertise From: Michael Solomon, Dr. Lee Ellenburg, & Dr. Rob Junod
Have you ever wondered how much rain your city received during a storm? Or how strong the winds were last week in the county where your grandmother lives? We’ve got a dashboard for that! We are excited to introduce the Alabama Climate Observing Network (ACON) Dashboard, a resource that brings together weather, climate, and soil observations from across Alabama in one easy-to-use location.
Ground observations collected at surface or near-surface hydrometeorological stations are critical for informing decisions in areas such as agriculture, weather forecasting, prescribed burns, and wildfire management. These stations are often part of larger networks that operate independently, each with its own data services, formats, and methods of access. This can make it difficult to find and compare observations from different networks.
The ACON dashboard was developed to address this challenge by bringing these independent networks together in a single location. Instead of searching through multiple websites and data systems to find observations from different networks, users can access them through one dashboard. This makes it easier to monitor current conditions, explore historical time series, and compare observations across the state. No more navigating multiple tabs and sources!
The dashboard was designed and developed by the Alabama Office of the State Climatologist with the University of Alabama in Huntsville’s Earth System Science Center to support three primary end users: the National Weather Service (NWS), the Alabama Forestry Commission (AFC), and the Alabama Office of the State Climatologist (AOSC). The development of the ACON dashboard was supported by the National Oceanic and Atmospheric Administration (NOAA) through the Cooperative Institute for Research to Operations in Hydrology (CIROH).
Each of these users can take advantage of ACON in different ways. Fire managers can check soil moisture before a prescribed burn, forecasters can cross-reference station data during severe weather, researchers can explore historical records, and agricultural or water-resource planners can track drought conditions in near real time. ACON was designed with these specific needs in mind, but its usefulness extends well beyond these groups.
NWS Huntsville participated in providing feedback during the creation of the ACON Dashboard, and is excited to have tested it during several weather events this year. Warning verification was made much easier by the one-stop-shopping style of the Dashboard, combining several observation types on one easy-to-use site. Dewpoint data quality issues at Meridianville Airport were made easier to troubleshoot by overlaying multiple types of archived observational data on one map for easy comparison. For future uses, the Winter and Climate Teams are excited to use the ACON Dashboard to inform products for Frost/Freeze Advisories, especially since those are now based on soil temperatures during the Spring Season. We're so very thankful for the opportunity to collaborate on such a useful product! (Chelly Amin & Kris White - National Weather Service Huntsville)
The dashboard can also benefit the general public. Gardeners can use station observations to help inform planting decisions, weather enthusiasts can explore conditions around the state, and students can use the data for school projects. Whether you are looking for recent weather observations, exploring how conditions have changed over time, or simply curious about what is happening at a weather station near you, ACON provides an easy way to explore Alabama’s weather, climate, and soil data.
The ACON dashboard was designed to bring together data from multiple networks into a unified platform. At this time, it serves as an aggregator of data, not a real-time monitoring system. Due to differences in update frequencies and data availability between the different platforms, some latencies could occur. As a result, the dashboard is not recommended for real-time operational decision making. It is also not intended to replace existing mesonets, but instead it adds value by combining hydrometeorological data from multiple platforms for easier data exploration across Alabama.
We would love for you to explore the dashboard for yourself! Visit ACON, choose a station, explore recent time series, and download data for your own use. The dashboard is live, but our work is ongoing! We welcome any suggestions on additional functionality or data requests. As you explore the dashboard and its data, please contact us at aosc@uah.edu with questions, comments or suggestions. Happy exploring!
Opening the Dashboard:
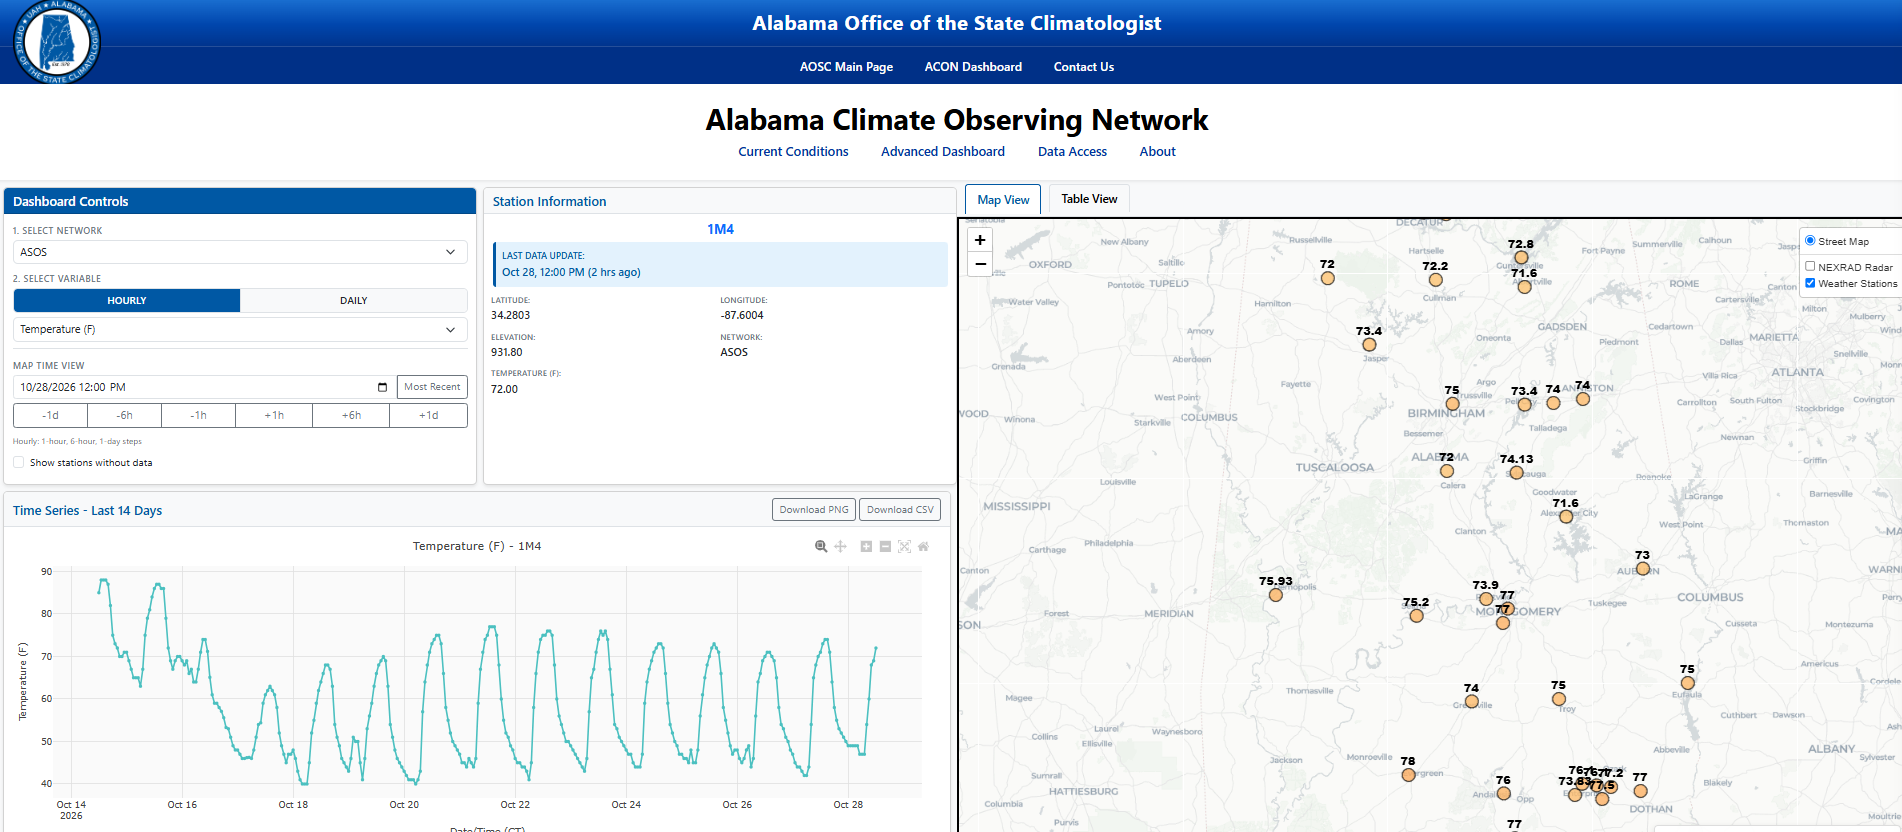
When you open the ACON dashboard it automatically loads the hourly temperature data for all stations across Alabama on the map displayed. If there are only a few stations plotted with temperature, use the time step option to go back in time an hour (-1h) and additional stations should populate. By default, only the stations with the most recent data are loaded.
There are two versions of the dashboard, the standard dashboard and the advanced dashboard. The standard dashboard is the default when loading the website and only displays variables most relevant to the general public such as temperature, precipitation, and wind speed. If you prefer to access all available variables you can utilize the advanced dashboard, which can be found under the website heading (highlighted in yellow below).

Exploring the Dashboard:
Once you have chosen your preferred dashboard version, select a specific network or all networks from the “Select Network” dropdown. Some of the networks provide hourly data, while others are limited to daily samples. Descriptions of each network can be found on the “About” page on the ACON dashboard or listed below.
Select the variable you wish to plot from the “Select Variable” dropdown.
Choose a station from the available options on the map or table to view station details and generate a time series plot of the selected variable. Station-specific information will appear in the Station Details section, and a time series of the selected variable will be plotted below the details.
Helpful Hints:
When switching between networks, select the desired variable in order to populate the map. You can view the data as either a map or a downloadable table by toggling between the tabs above the map.
To download and use the data for your own purposes, navigate to the Data Access tab. This feature allows you to create customized datasets using your selected networks and the variables available within each dataset.
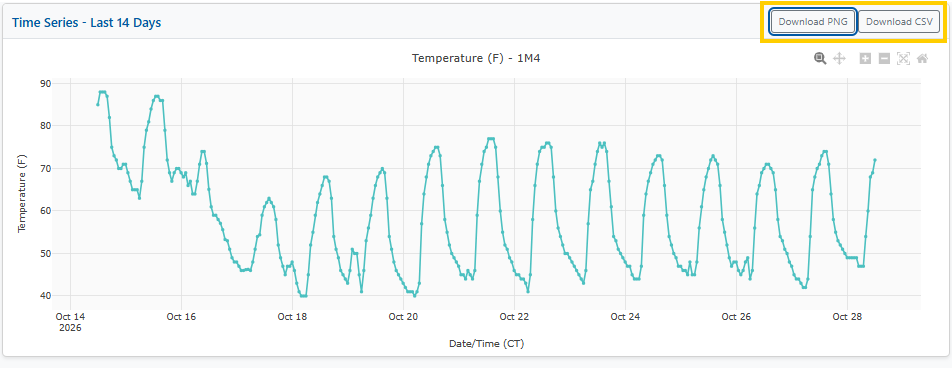
One additional neat feature is the ability to download the displayed time series plot as a PNG image or download the data used to generate the plot as a CSV file. The buttons for both of these functions are located at the top right of the time series plot, highlighted below.
What Data Are Available on ACON?
ACON currently ingests and displays data from eight existing weather station networks, each with its own map, format, and update cadence. The dashboard allows users to visualize and access the data from these independent networks in a singular location, enhancing the ability to monitor current conditions, explore historical time series, and compare data across the state.
- The Automated Surface Observing System (ASOS) is a joint program between the NWS, the Federal Aviation Administration, and the Department of Defense. ASOS stations are located primarily at airports and support aviation safety and public forecasting.
- The U.S. Climate Reference Network (CRN) consists of stations located in pristine, protected locations in order to detect long-term climate change signals. These stations are operated by NOAA’s National Centers for Environmental Information along with NOAA’s Air Resources Laboratory.
- The Soil Climate Analysis Network (SCAN) focuses on agricultural areas and measures soil moisture, temperature, and standard weather variables. SCAN stations are operated by the USDA’s Natural Resources Conservation Service, National Water and Climate Center.
- NWS Cooperative Observer Program (COOP) is the nation’s oldest and most extensive weather network. This network has been run by the NWS since 1890 and depends on thousands of trained volunteers who take daily temperature and precipitation readings across the country.
- Auburn Mesonet is operated by Auburn University through the Alabama Agricultural Experiment Station. Data delivery is provided by AWIS Weather Services.
- Remote Automated Weather Stations (RAWS) are intended for wildfire danger monitoring in remote, fire prone areas. RAWS is run jointly by the U.S. Forest Service and the Bureau of Land Management, coordinated through the National Interagency Fire Center.
- The Community Collaborative Rain, Hail & Snow Network (CoCoRaHS) is a citizen-science network in which volunteers take daily, manual precipitation measurements at their properties. The network began in Colorado State University’s Colorado Climate Center.
- The Soil Temperature, Environment, and Moisture Monitoring Network (STEMMNet) was built at UAH to improve drought and wild-fire risk assessment. STEMMNet uses rapidly-deployable, low-cost soil moisture and temperature sensors, developed in collaboration with the Alabama Forestry Commission and several NWS forecast offices.