The Hunt for Pivots
If you've ever looked across an Alabama farm and seen a large metal arm slowly moving across a field, you've probably seen a center pivot irrigation system.
Center pivots are one of the most common forms of irrigation in Alabama, but for years, there was a simple question the state couldn't easily answer: Where are these center pivots?
Compared with some of our neighboring states, Alabama has historically had relatively little statewide information on the location of irrigation systems. This made it difficult to characterize where irrigation occurs, how it changes over time, and how those changes relate to Alabama's agricultural landscape.
National programs exist that have developed automated methods to identify and monitor irrigation pivots using satellite data. In Alabama, however, the state's highly vegetated and diverse landscape makes automated identification challenging. Irrigation systems can be obscured by vegetation or differ enough in shape that they can be difficult to identify reliably using automated methods alone.
To address this gap, the Alabama Office of the State Climatologist (AOSC), hosted at the University of Alabama in Huntsville (UAH), developed a statewide survey using high-resolution aerial imagery to identify irrigation pivots across Alabama.
Center pivot systems are particularly useful for this type of analysis because they are common across the state and leave recognizable patterns in aerial imagery. By documenting their locations, researchers can develop a spatial record of irrigation that can be used to examine patterns in agricultural water use.
This information can also help identify where irrigation systems are being removed and provide insight into why those changes are occurring. In some locations, for example, agricultural land has been converted to residential, industrial, or other uses.
The result of the surveys is a dataset that provides a statewide record of center pivot irrigation systems and how their distribution has changed over time.
How We Collected 20 Years of Irrigation Data
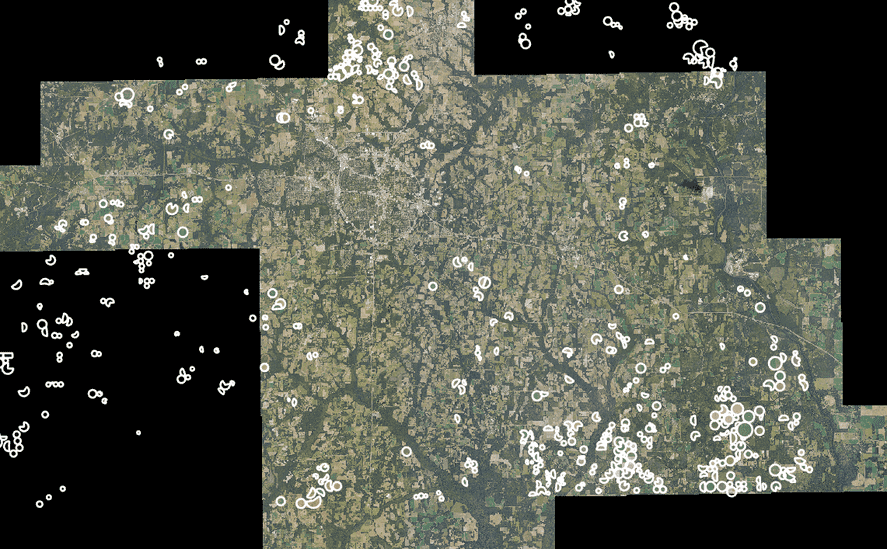
While various state and national databases have county or statewide totals for irrigated areas, they do not have totals for smaller scale or overlapping regions. The first Alabama center pivot survey was conducted in 2016 with a simple need - to know where irrigation pivots were located. Led by Cameron Handyside of UAH, undergraduate students used aerial imagery from 2006 to establish a baseline, and then proceeded to survey 2009, 2011, 2013, and 2015. A second survey was led by UAH in partnership with Auburn University and funded through the Alabama Department of Economic and Community Affairs, Office of Water Resources to expand upon the original survey and understand past and potential future changes in agriculture. This survey covered the years 2017, 2019, and 2021. Now sponsored by the AOSC and led by Krel Haynes, the irrigation survey is conducted every two years to identify irrigation pivots and document changes in their location and characteristics.
The primary imagery source for these surveys is the National Agricultural Imagery Program (NAIP). When the pivot surveys began, NAIP imagery had a resolution of approximately one meter per pixel. Today, the imagery provides resolution as fine as 60 centimeters per pixel, allowing researchers to identify more detailed features of irrigation systems and agricultural fields.
Even with increasingly detailed imagery, identifying pivots still requires human interpretation. Not every irrigation system forms a perfect circle. Traditional center pivots typically consist of a long irrigation arm rotating around a fixed center point, while newer systems can include flexible sections that bend to follow irregular field boundaries or avoid nearby obstacles. Because of these variations, it was important that researchers examine the imagery themselves rather than rely solely on automated methods. This allowed the team to recognize irrigation systems that automated methods might miss.
Over nearly two decades of imagery, the project has documented a notable pattern: the number of irrigation pivots has increased, while the average size of the pivots has decreased as farmers remove overlap and find better coverage of their fields with multiple smaller pivots, instead of one or two large pivots.
What 20 Years of Data Tells Us
After nearly two decades of surveying center pivots, the data provide a much clearer picture of where irrigation occurs across Alabama, how it is changing, and which crops rely on it most.
Alabama Pivot Irrigation is Sparse Relative to Neighboring States
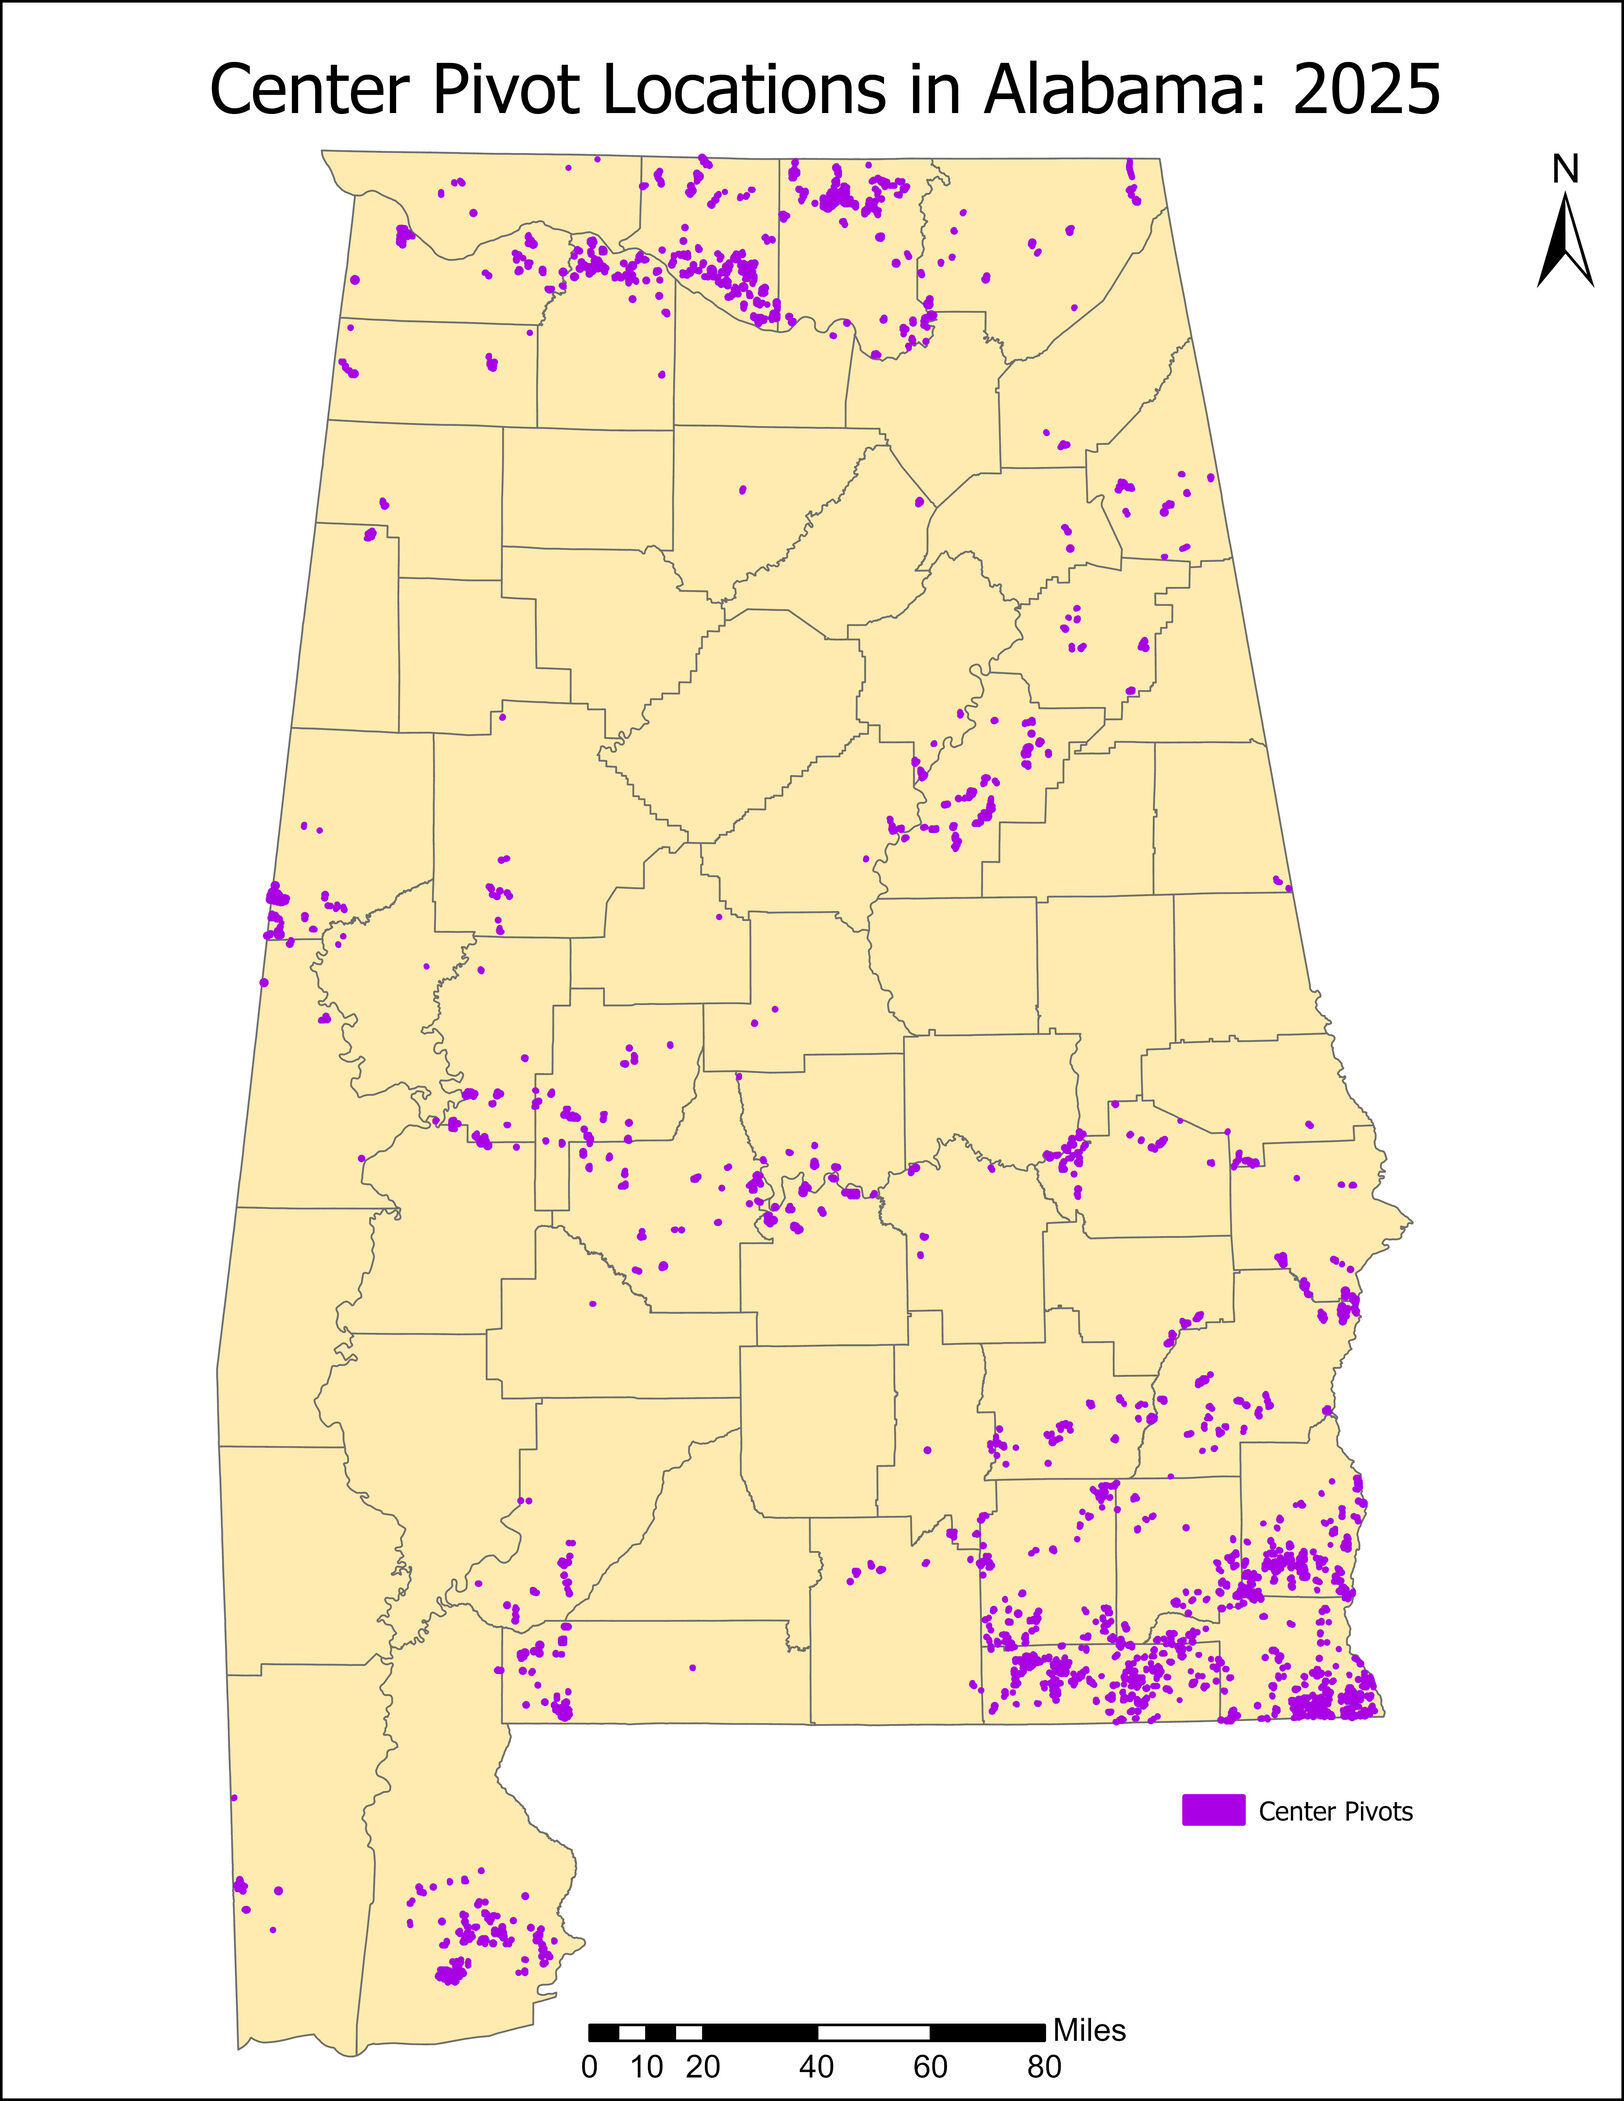
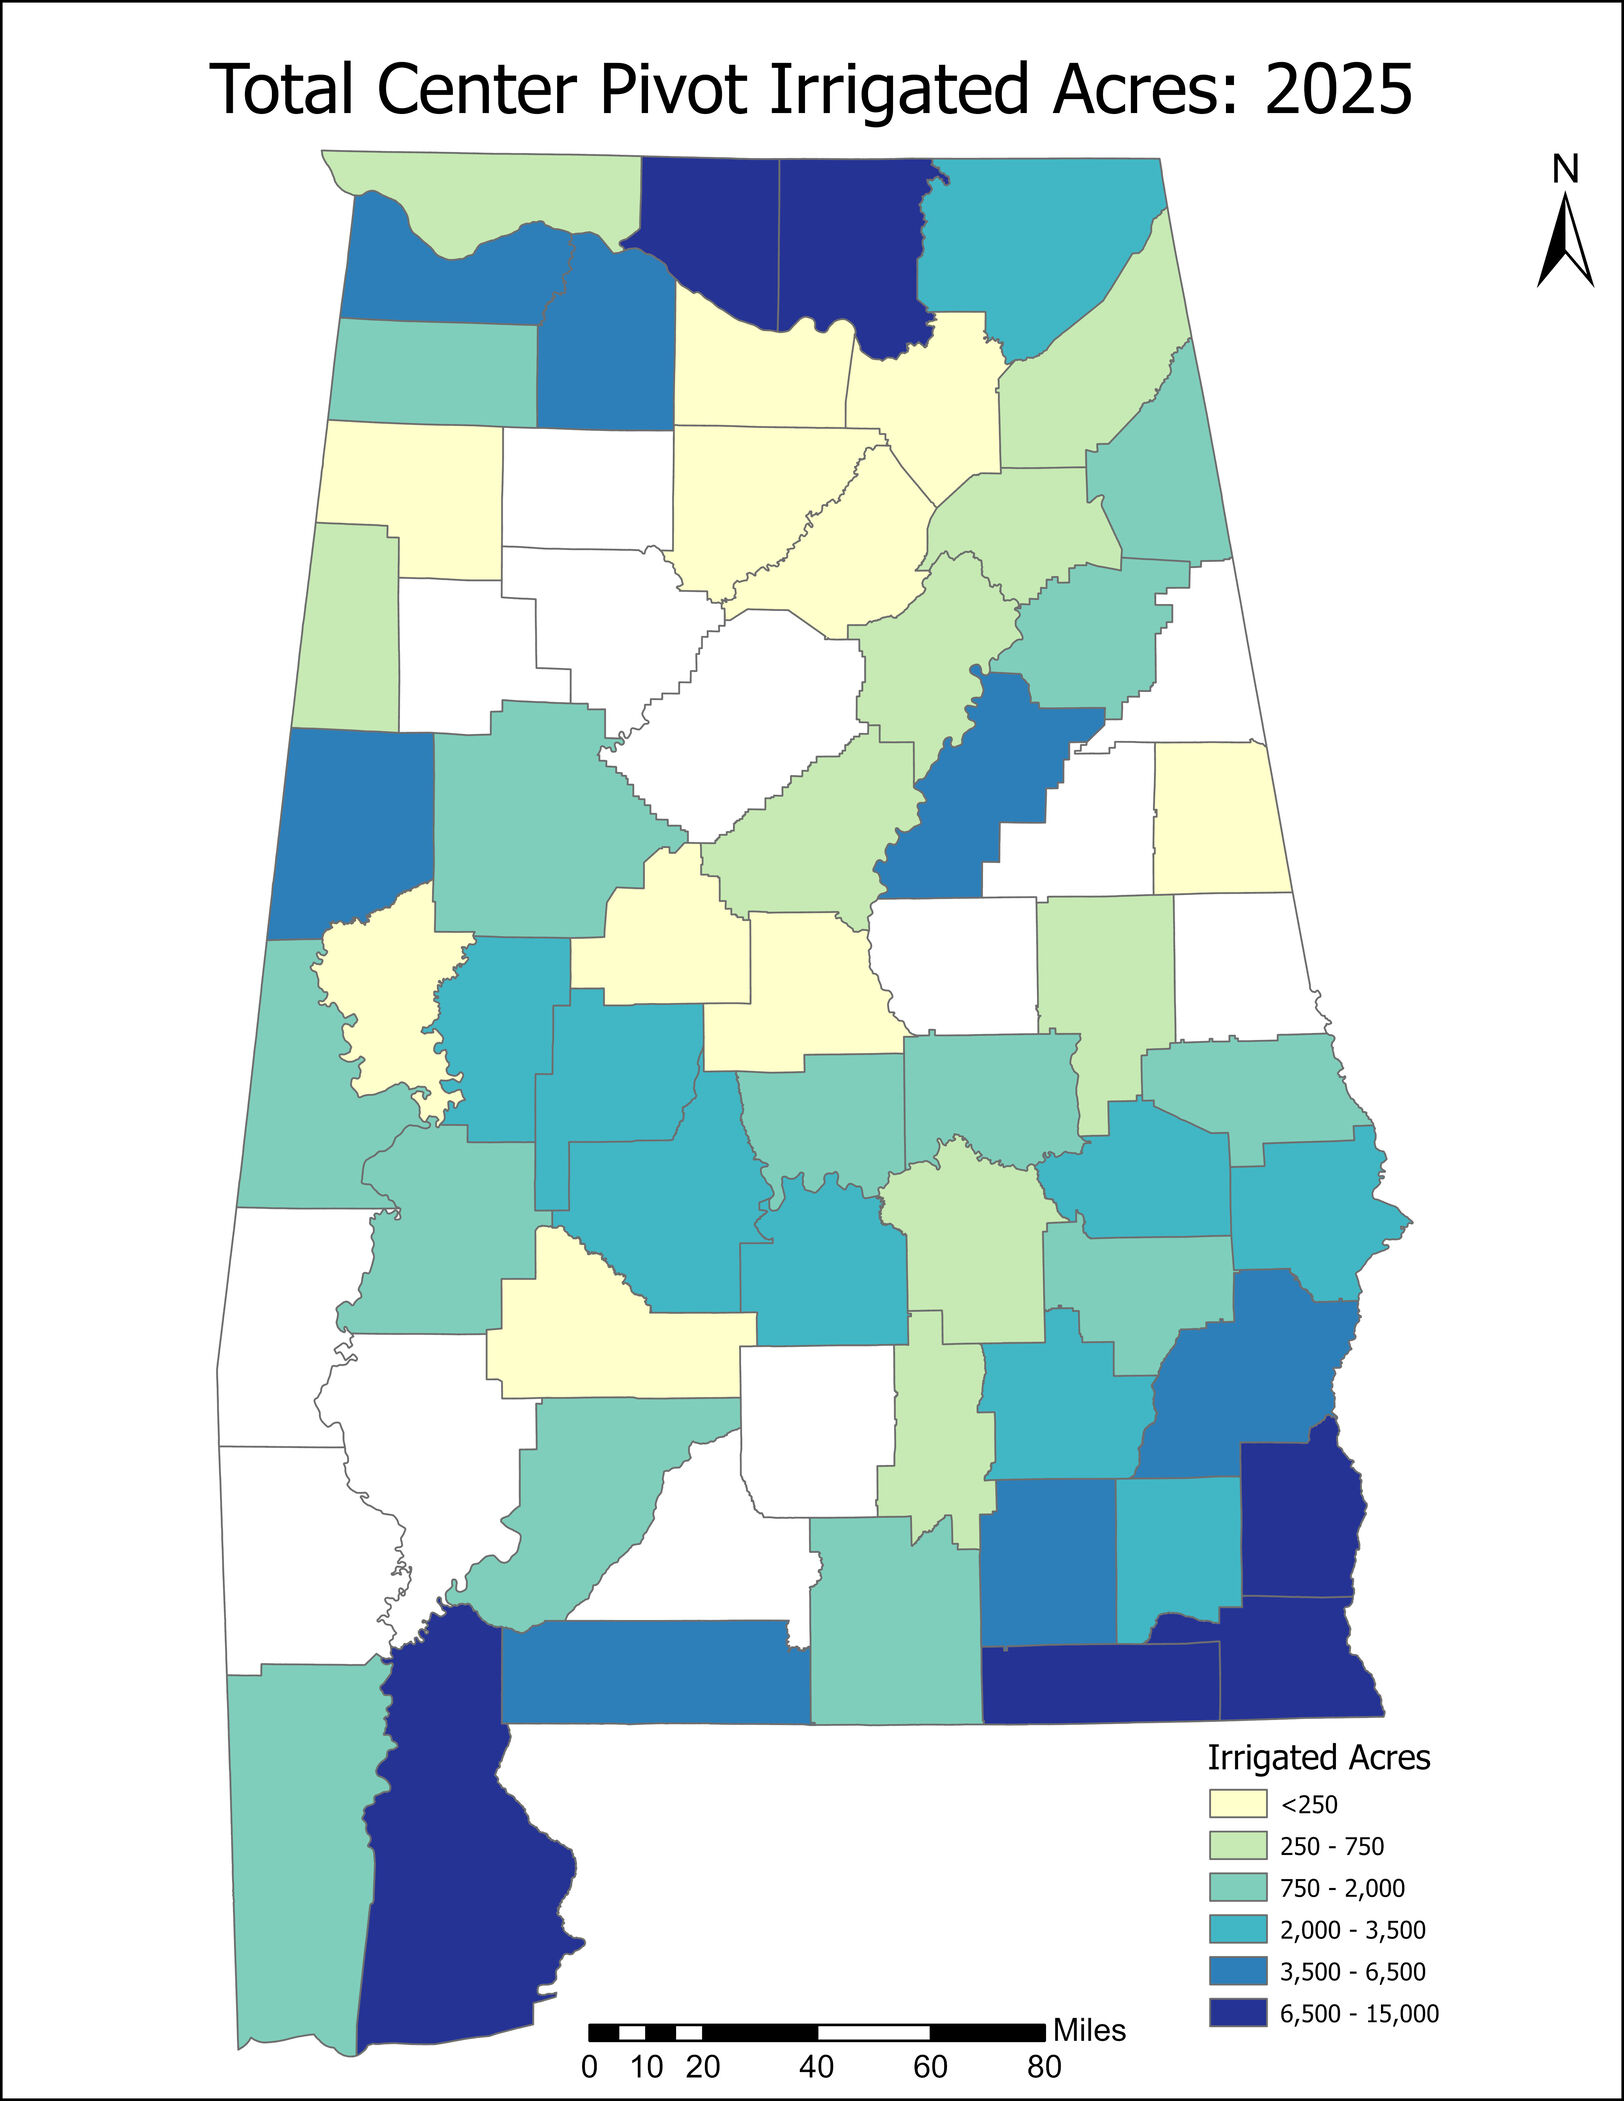
Center pivot irrigation is sparse in Alabama and is not evenly distributed across the state. The highest concentration occurs in Southeast Alabama, particularly throughout the Wiregrass region, where Houston County takes the lead as the county with the most center pivots. Central and western Alabama, by contrast, feature far less irrigated acreage, with many counties having little to none.
Other notable clusters are spread across key agricultural pockets, including the Tennessee Valley, portions of the Black Belt, and Baldwin and Escambia Counties near the Gulf Coast. Irrigation is also prominent along the Coosa Valley, stretching south from Cherokee County toward Talladega County. Together, these regional patterns highlight the distinct local variations in water infrastructure and farming intensity across the state.
Irrigation Is Changing
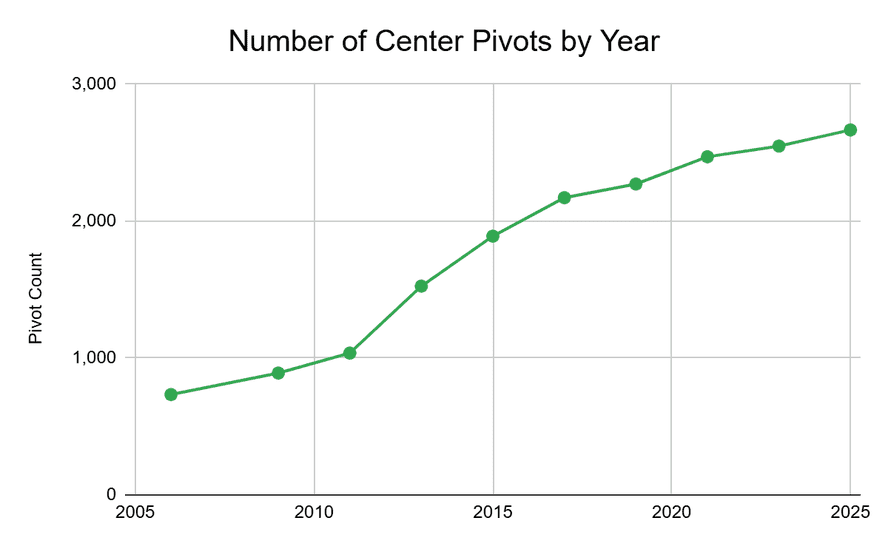
The long-term dataset shows that irrigation has generally increased across Alabama. The number of center pivots increased steadily over the past two decades, with the most noticeable growth occurring during the 2010s. More recently, the rate of increase has slowed.
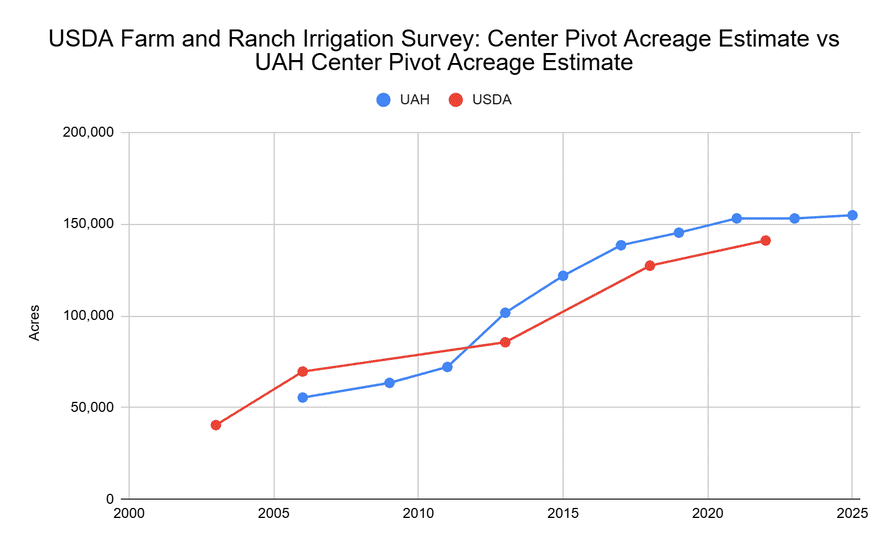
Our estimates of total irrigated acreage show a similar overall increase to U.S. Department of Agriculture (USDA) estimates, although our survey generally identifies more irrigated acreage. While USDA data tell us how much land is irrigated, our high-resolution aerial survey reveals where those irrigated fields are actually located, highlighting the distinct value of direct spatial mapping over relying on survey estimates alone.
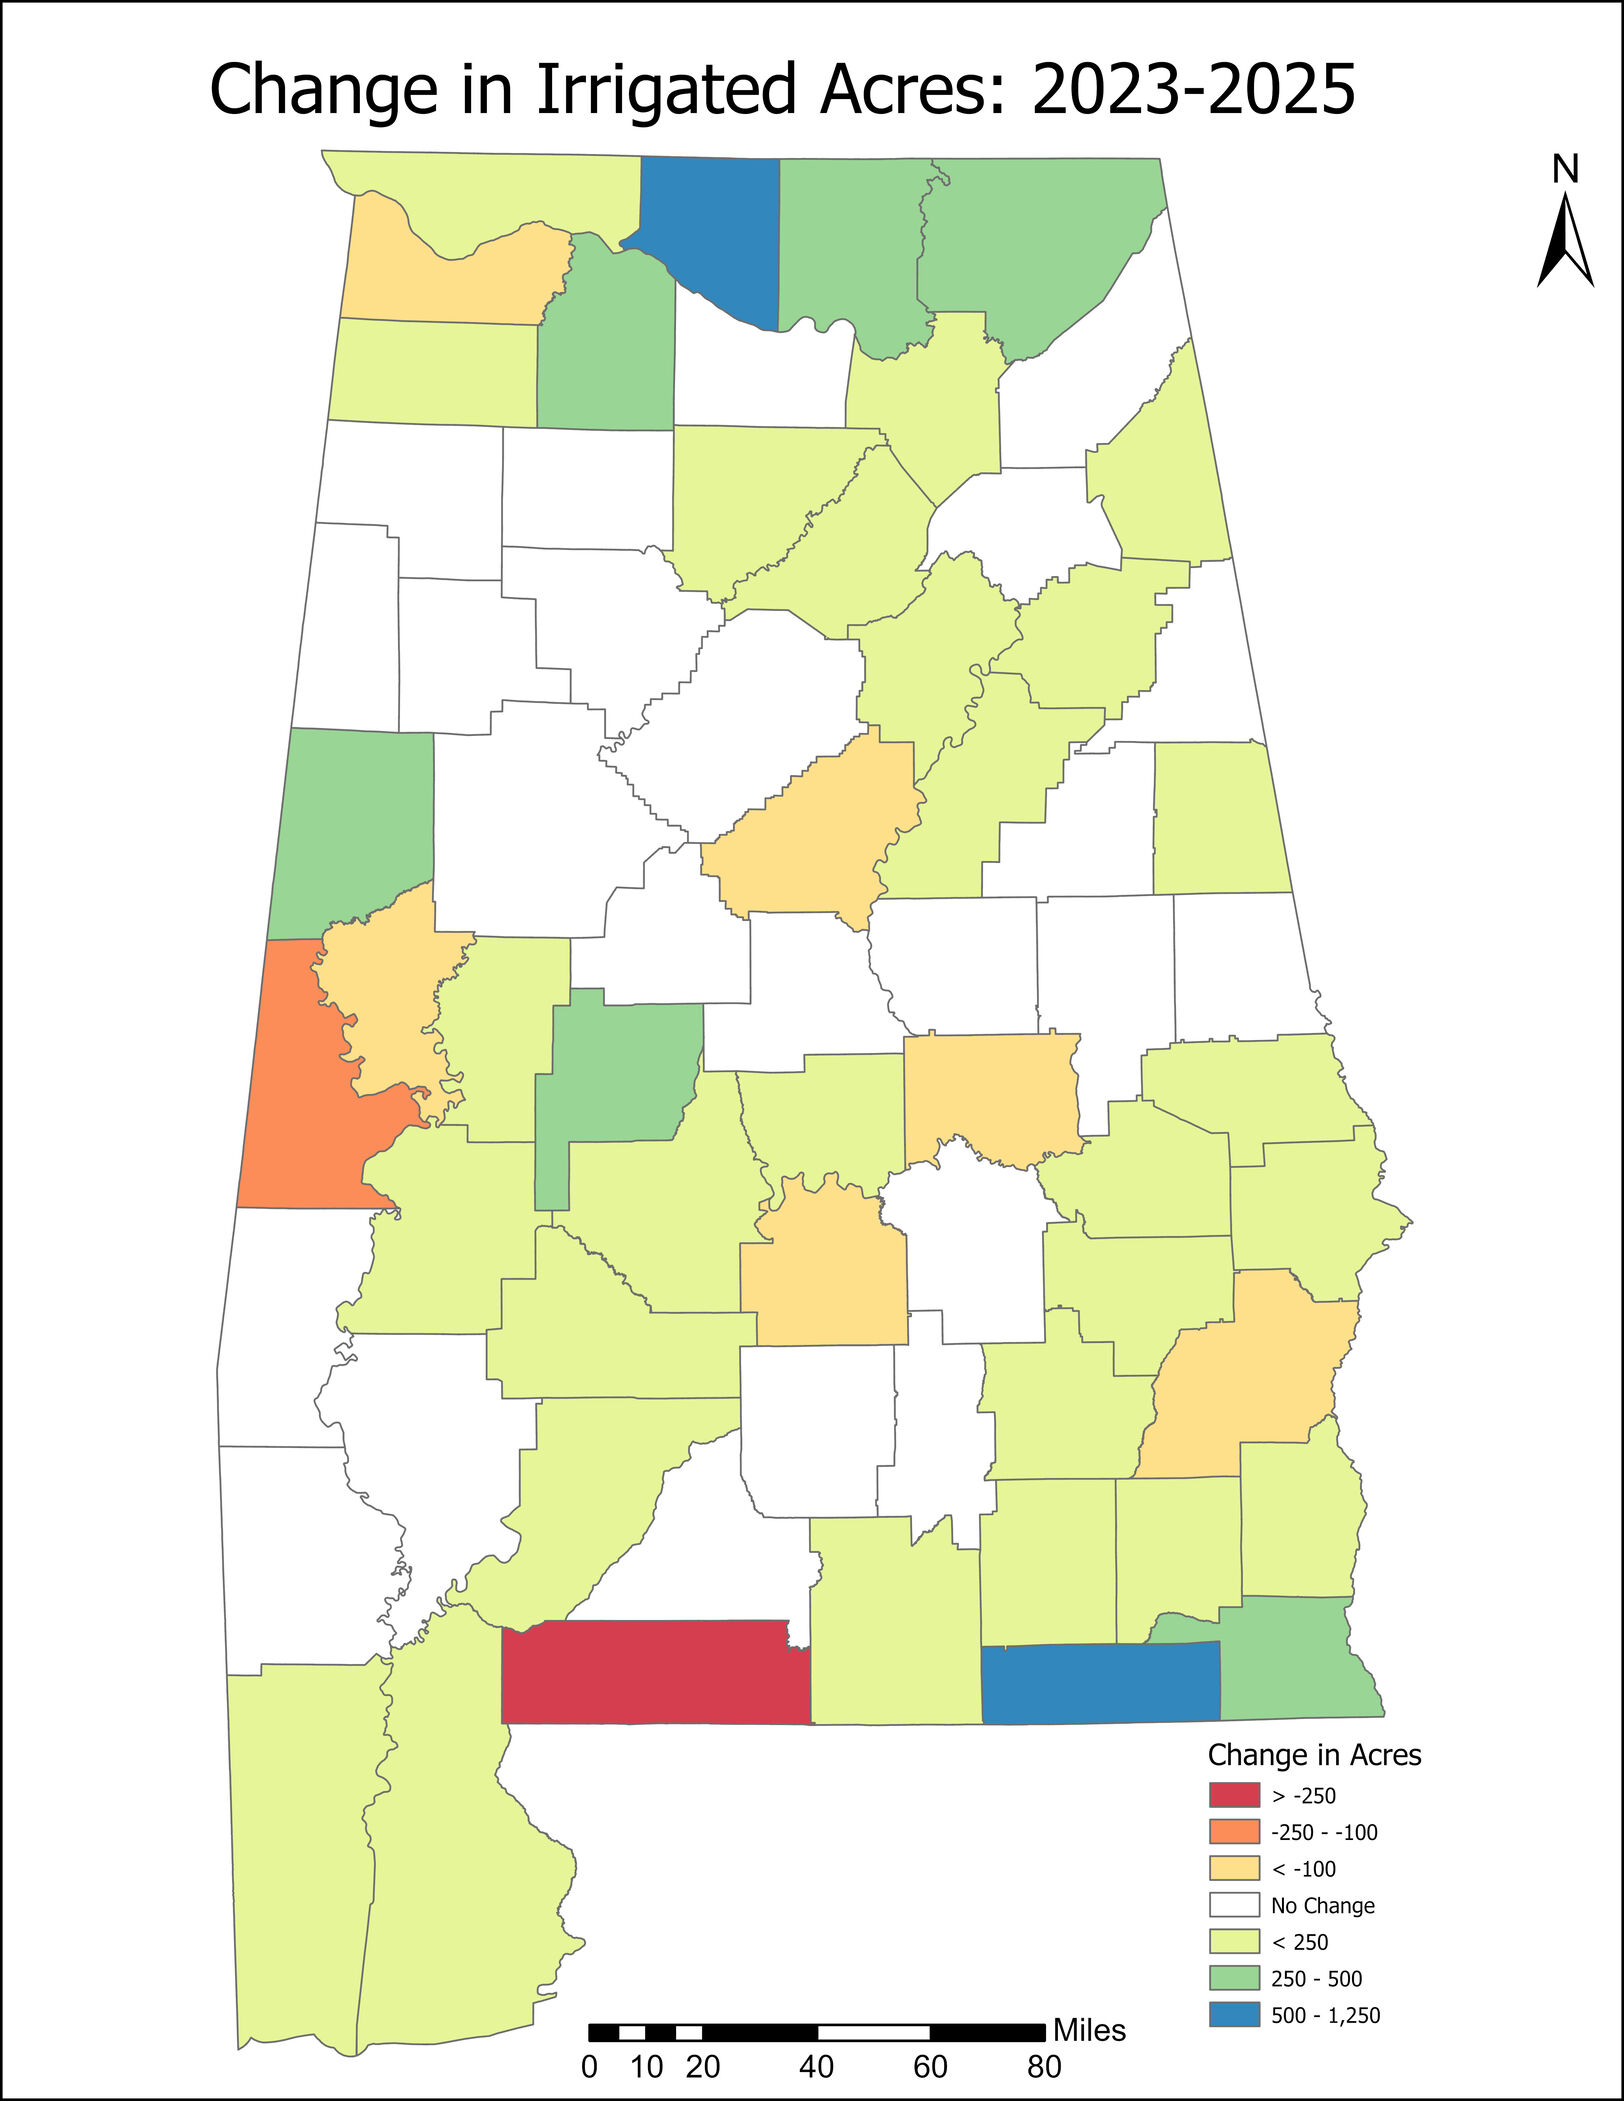
The data also show that irrigation is not increasing everywhere. Between 2023 and 2025, some counties gained irrigated acreage while others lost it.
For example:
- Geneva and Limestone Counties added the most irrigation with a combined 29 center pivots, covering approximately 1,748 acres
- Baldwin and Escambia Counties experienced the most irrigation loss due to expanding development
- Other areas lost irrigated acreage when pivots were retired, moved, or removed as land was developed.
These changes show that irrigation data can tell us more than where water is being used. It can also provide a window into broader changes in Alabama's agricultural landscape.
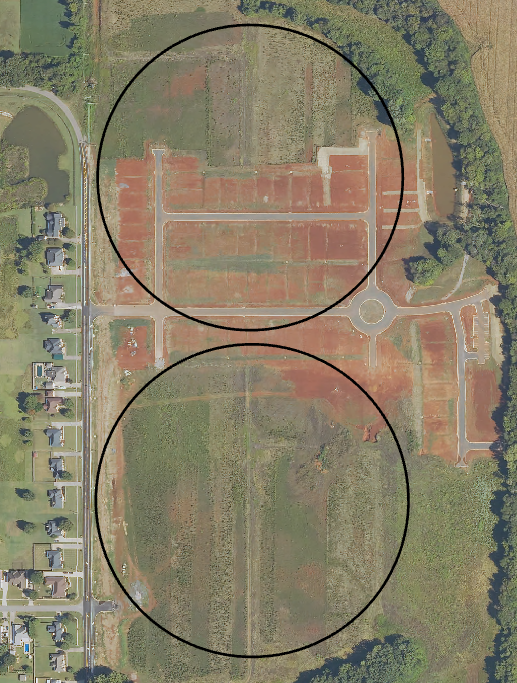
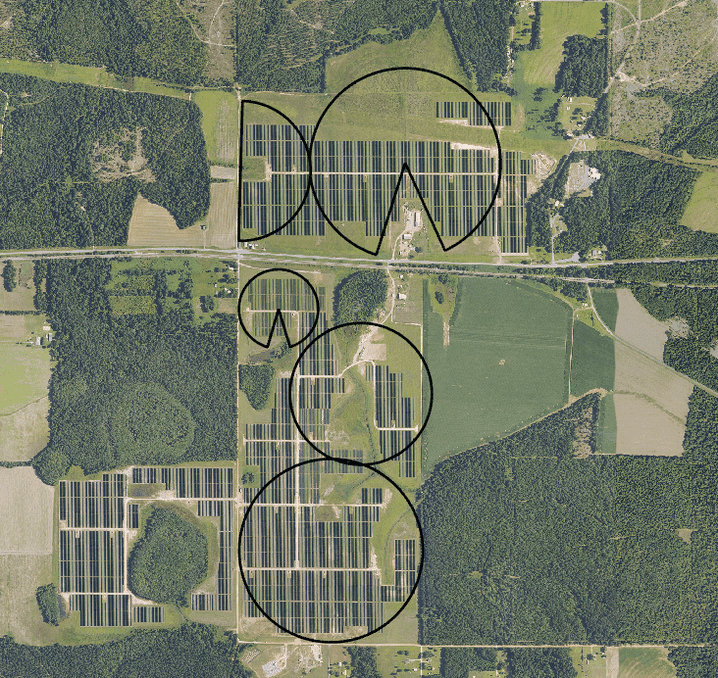
Figures 2 and 3. We’ve found several examples where agricultural land and center pivots are being lost to other land uses. In these examples, irrigated farmland was converted either to solar farms or residential development, illustrating how land-use change can reduce both agricultural acreage and irrigation infrastructure.
More Pivots, Less Irrigated Land per Pivot
One of the more interesting findings from the long-term record is that the number of center pivots has increased while the amount of land irrigated by each pivot has generally decreased.
This distinction is important. A county can have more irrigation systems without seeing the same proportional increase in total irrigated acreage. The size of the farms and the area covered by each irrigation system both influence the total amount of irrigated land.
The long-term data allows researchers to track both measures, providing a more complete picture of how irrigation systems are changing across Alabama.
What Crops Rely on Irrigation?
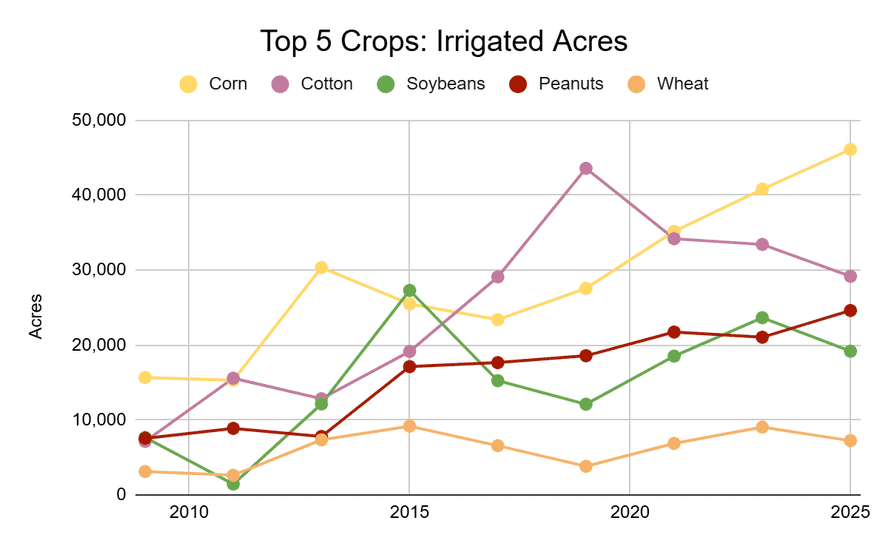
Our data show that the five crops with the most irrigated acreage in Alabama are corn, cotton, soybeans, peanuts, and wheat. These crops can have critical water needs during pollination and early reproductive growth, which occur during relatively short periods. Those periods can also overlap with conditions that favor rapid drought development. If drought hits during those critical times, irrigation can really make an impact on how crops survive and fare for the rest of the growing season.
Our data also show that irrigation trends vary among Alabama’s major crops:
- Corn: Irrigated acreage has steadily increased since 2017.
- Cotton: Irrigated acreage has decreased somewhat in recent years.
- Soybeans: Irrigated acreage has also decreased somewhat in recent years.
- Peanuts: Irrigated acreage has increased gradually over time.
These trends show that irrigation is not changing uniformly across Alabama or across crops. The long-term dataset allows us to track those changes and better understand how irrigation supports Alabama agriculture.
Some Pivots Are More Interesting Than Others
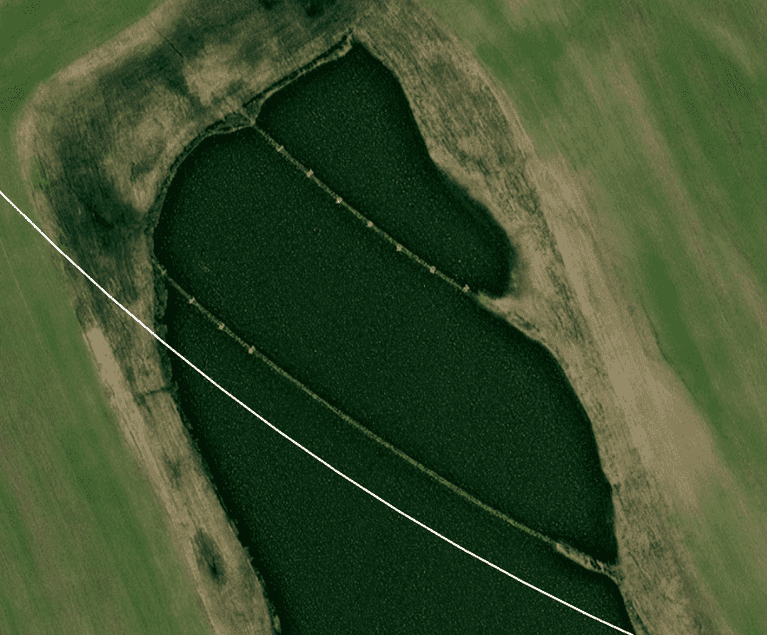
Krel and his team have spent countless hours over several summers staring at the computer screen and counting pivots. And they have definitely seen their fair share of interesting pivot setups. Here are just a few examples of Krel’s favorite finds!
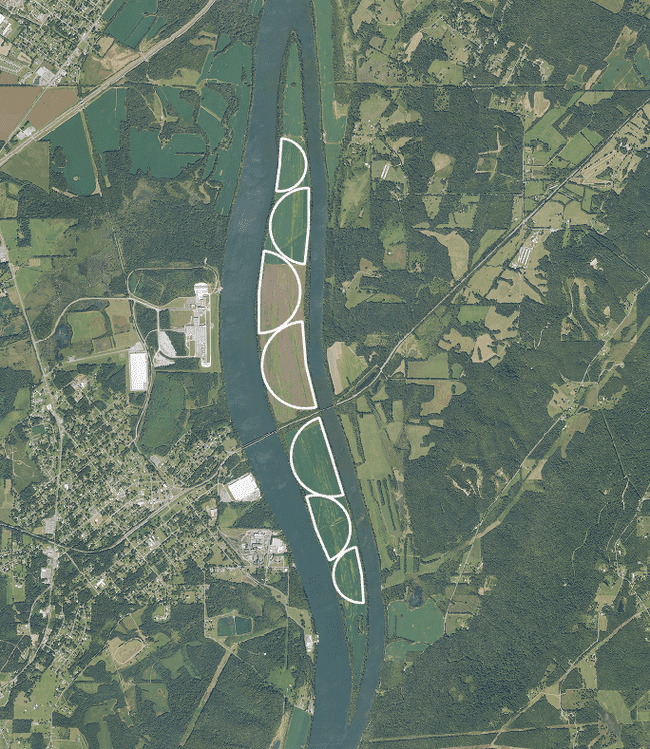
Image A) Pivot Island — This interesting array of individual pivots sits on a thin strip of island in the Tennessee River in Jackson County, Alabama, right at the Tennessee border. Funnily enough, the island looks like it is just the right size to perfectly fit these seven half pivots.
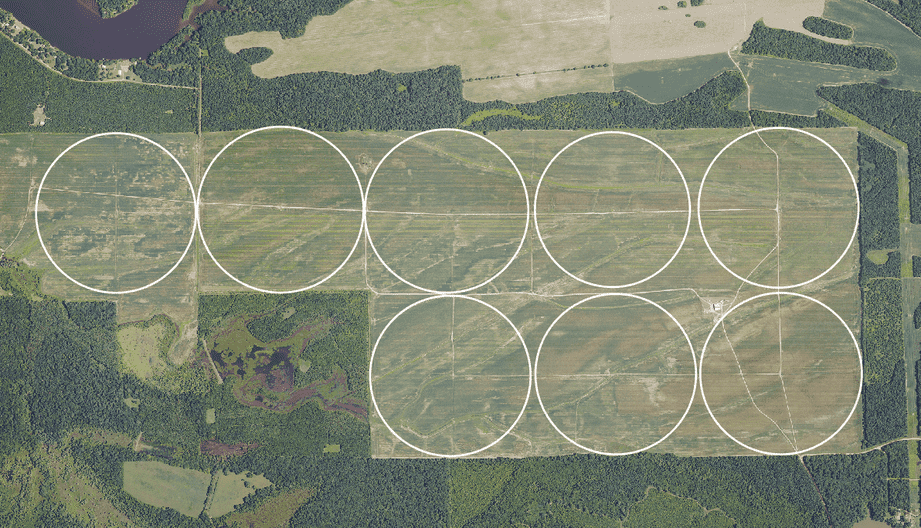
Image B) Pivot Group — Most pivots are circular in nature (or half circles) and generally stand alone or in small clusters. But every now and then, Krel and his team would notice these very uniform groupings, generally on very rectangular farms. This is a great example of how much land a few pivots can cover. The team believes that even though there are eight distinct circles, there are actually only a few pivot arms and the farmer probably manually moves the center pivots around to irrigate different areas. Can you imagine moving these pivots?
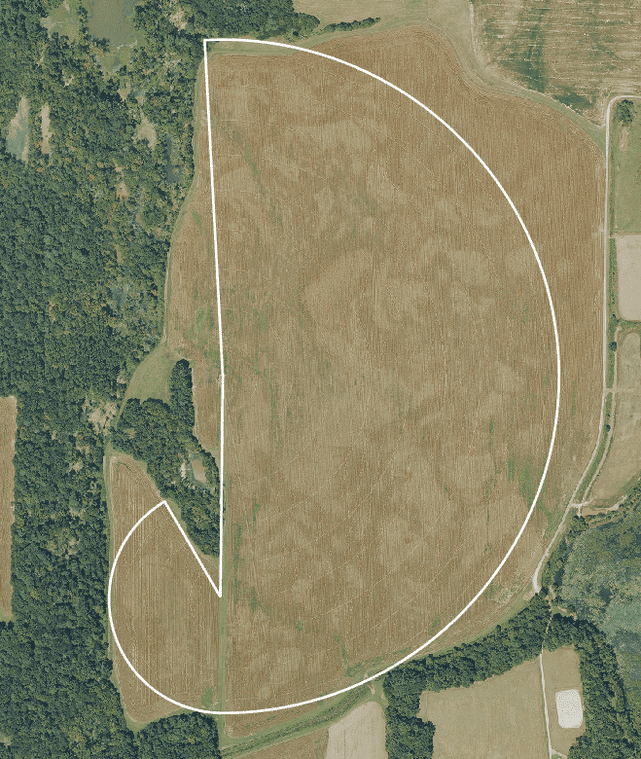
Image C) Fibonacci’s Pivot — This interesting center pivot in Limestone County just so happens to have a shape that resembles the Fibonacci sequence. Why does this pivot look like this? It appears that the pivot can bend on the short end, allowing it to swing around the final corner and reach that last little bit of oddly shaped field at the bottom. They say you can find the Fibonacci sequence all around nature, but who knew you could find it in a center pivot too?
Image D) Pivot Bridge — It is not uncommon to see producers build berms or dirt mounds to help pivots safely maneuver over uneven terrain, stay elevated in low-lying flood zones, or even cross small bodies of water such as retention ponds. In this case, the landowner appears to have actually engineered two legitimate bridges that the pivot wheels can maneuver over to safely cross the pond. Engineering at its finest!
Looking Ahead
We will continue surveying irrigation pivots across Alabama, adding new years of data to this growing record. As the dataset expands, it will provide an increasingly detailed picture of how irrigation changes across the state. We will also continue working with partners such as the Natural Resources Conservation Service, Alabama Soil & Water Conservation Committee, Alabama Extension, and the Alabama Universities Irrigation Initiative to share and put this information to use. There is still much more to learn, and we are not done counting pivots yet!